
Major Elements Concentrations in Chang’E-3 Landing Site from Active Particle-Induced X-ray Spectrometer

1
State Key Laboratory of Lunar and Planetary Sciences, Macau University of Science and Technology, Macau 999078, China
2
China National Space Administration (CNSA), Macau Center for Space Exploration and Science, Macau 999078, China
3
Space Optoelectronic Measurement and Perception Lab, Beijing Institute of Control Engineering, Beijing 100190, China
4
Center for Lunar and Planetary Sciences, Institute of Geochemistry, Chinese Academy of Sciences, Guiyang 550081, China
*
Author to whom correspondence should be addressed.
Remote Sens. 2023, 15(6), 1643; https://doi.org/10.3390/rs15061643
Submission received: 2 February 2023
/
Revised: 15 March 2023
/
Accepted: 15 March 2023
/
Published: 18 March 2023
(This article belongs to the Special Issue High-Resolution Observations of Planetary Geological and Geomorphic Investigation)
Abstract
:On 14 December 2013 (UTC), China’s Chang’E-3 (CE-3) succeeded in landing on the Moon’s surface. The CE-3 landing site is in northern Mare Imbrium and several tens of meters away from the rim of a young crater with a few hundred meters in diameter. In-situ measurements of lunar soil around the roving area were conducted from Active Particle-induced X-ray Spectrometer (APXS) onboard Yutu rover. Three relatively young lunar soil samples in the CE-3 landing site were investigated. Previous studies suggested that these samples are a new type of basalt, not discovered yet in previous missions before the CE-3 in-situ measurements. It plays an essential role in promoting the understanding of lunar volcanic history. However, their results are deviated, and thus scrutinizing the data as per our optimized model to derive a more precise result is of necessity. In this paper, we present an optimized model for data analysis based on APXS measurements to derive the major elements concentrations. The optimized model has the advantages of reliability and being independent of calibration by ground standards. The particle size effect is applied in lunar X-ray fluorescence modeling for correction, improving the accuracy in determining the elemental concentrations for the actual measurement. Our results are distinct in the correlation plots by carrying out a comparison with previous lunar regolith samples from Apollo, Luna, and Chang’E-5 missions, indicating that the CE-3 landing site is a new region apart from previous in-situ or laboratory detection prior to the CE-3 measurements. It suggests a kind of young mare basalt with unusual petrological characteristics compared with previous samples and similar geochemical properties of CE-3 landing site and western Procellarum and Imbrium (WPI), with a signature of western Procellarum.
1. Introduction
Chang’E-3 (CE-3), the first Chinese lunar lander and rover mission, was launched at 17:30 on 1 December 2013 (UTC). On 14 December 2013 (UTC), it succeeded in landing on the Moon’s surface, and the Yutu (Jade Rabbit, named from the Chinese mythology) rover was separated from the lander about 8 h later after soft landing on the Moon [1]. The success of this mission marks the first soft landing on the Moon since 1976. The CE-3 landing site is in northern Mare Imbrium at (44.12N, 19.51W), near the boundary of two different geologic units [2,3,4,5,6]. The landing site sits on “young” Eratosthenian lava flows that spread several hundred to thousands of kilometers [3,5,7]. These lava flows have an estimated depth ranging from approximately 31 m to 43 m, with an average of around 37 m [7]. The mare basalts in the landing site are believed to have formed from the lava flows around 2.35 brillion years ago (Ga) based on crater counting [7], which are significantly younger than all of the lunar samples returned prior to the CE-3 in-situ measurements, dating from 3.1 to 3.8 Ga [4].
This makes the landing site of great scientific value for investigating the geochemical characteristics of relatively young lunar samples with in-situ detection, the Eratosthenian lava flows, and lunar magma evolution in a later stage.
Yutu landed at 50 m away from the eastern ring of a crater Zi Wei, with a diameter of ~450 m (see Figure 1 in [8] and Figure 1). Based on the crater counting, crater Zi Wei has a model age of ~27–80 My ago [8,9]. Yutu travelled around the rims of crater Zi Wei; the roving area is full of sputtered rocks which are partially bedded under a thin regolith with about 1 m thickness based on the data of Yutu’s Lunar Penetrating Radar (LPR) [8]. The ejecta layer has a thickness of ~4 m. Under the ejecta layer, a boulder-bearing paleoregolith layer from space weathering and the impact gardening of the Eratosthenian basalts (2.35–2.95 Ga) extends to the depth of ~8 m [8]. The layer of Eratosthenian basalts extends to the depths of ~50 m followed by a ~10 m paleoregolith formed on top of ~90 m thick Imbrian basalts, which are the latest Imbrian basalts that filled the basin around 3.3 Ga [5,8].
In previous lunar missions, a broad region around the CE-3 landing site was investigated by the orbital chemical compositional measurements from the Gamma-Ray Spectrometer (GRS) onboard Lunar Prospector (LP), Ultraviolet/Visible (UV-VIS) camera onboard Clementine, Multispectral Imager (MI) onboard SELENE-1, and Moon Mineralogy Mapper (M) onboard Chandrayaan-1.
Using the remote sensing measurements from LP-GRS, the chemical compositions of the adjacent region of the CE-3 landing site (43.0–45.0N, 17.5–20.0W) were derived by Prettyman et al., 2006 [10]. The measurements showed the FeO content of 20.4 wt.% and TiO content of 5.0 wt.% (2 per pixel binning). However, the spatial resolution of LP-GRS is dependent on the spacecraft’s height above the lunar surface [11], and is ~60 km/pixel (equal area of 22) [10,11,12], which may not be sufficient for detailed geological analysis. This means the elemental abundance data represent the mean values on a broad regional scale, whereas it still provides us with significant results for valuable information, e.g., characterizing geological units and classifying rock types.
Along with CE-3 mission, which is a landing on Moon after a long period of time since Apollo missions, the remote sensing studies with advanced instruments reported on the CE-3 landing site as well. The Clementine UV-VIS data (average spatial resolution of 115 m/pixel) indicate the FeO content of ~19 wt.% and TiO content of 5–7 wt.% for the region near the CE-3 landing site, as given by Ling et al., 2015 [3]. Also, using the highest spatial resolution of about 20 m/pixel data of MI onboard SELENE-1 available, the study area including the CE-3 landing site (see unit Em (Eratosthenian mare materials) in Figure 8 in [5]) has the abundances of FeO of ~18 wt.% and TiO of 5–10 wt.%, which is obtained by Zhao et al., 2014 [5]. It should be noted that there is a slight difference between the results of LP-GRS and MI onboard SELENE-1, given by Prettyman et al., 2006 [10] and Zhao et al., 2014 [5], respectively, for the FeO content in particular; additionally, their results for the TiO content seem at the upper limit of the class of low-Ti mare basalts or should be attributed, to some degree, up to low-intermediate Ti mare basalts. Furthermore, the high spatial resolution of ~140 m/pixel and 85 spectral bands observational data of the M onboard Chandrayaan-1 were mapped into 83 different spectral units in Mare Imbrium in Thiessen et al., 2014 [6]. As marked in Figure 2A in [6], the CE-3 landing site is located within the unit numbered 80, suggesting in favor of high-Ti basalts and confirmed in the 2860 nm map, but adjacent to the southern boundary of the low-Ti unit numbered 8. It also indicates that unit 80 is olivine and/or clinopyroxene richer than unit 8, as shown in the absorption bands minima at 1000 and 2000 nm [6]. While compared with the above-mentioned remote sensing studies, it is noticed that the abundance of TiO needs to be accurately identified since it is probably spectral mixing due to regolith formation, as pointed out by Thiessen et al., 2014 [6]; besides, according to Wang and Wang, 2015 [13], the two lunar soils in CE-3 landing site are suggested that it may be the fragments of low-Ti mare basalts (<6 wt.% TiO) based on the APXS data. Herein, in-situ measurements from APXS can provide a much better statistical and spatial resolution data, and thus the APXS onboard Yutu rover can verify the major elements concentrations of the roving area in this study.
Chemical elements concentrations of the roving area were measured from the Active Particle-induced X-ray Spectrometer (APXS). APXS is the sole payload mounted on the robotic arm of the Yutu rover. It utilizes incident X-rays emitting from radioactive sources to irradiate the surface material, resulting in the production of fluorescent characteristic X-rays. By analyzing the fluorescent X-ray spectra recorded by APXS, one could derive the concentrations of major elements such as Mg, Al, Si, Ca, Ti, and Fe of the measured lunar samples. Zhang et al., 2015 [2], Ling et al., 2015 [3], and Wang and Wang, 2015 [13] utilized the APXS data to derive the elemental concentrations in CE-3 landing site with different methods.
In the following, we will briefly describe the method used in their studies. (1) Zhang et al., 2015 [2] used a method to derive the elemental concentrations of the CE-3 soil samples by fitting the net peak areas from the spectra. The method involved correcting for background and overlapping peaks and eliminating the effect of the decay of the Fe and Cd sources. The calibration was conducted using ground standards and working references. The data analysis were processed using PyMca software. We note that the method is dependent on the calibration by ground laboratory standards upon analysis; besides, the accuracy of the result depends on the calibration by ground laboratory standards, which must have similar geological features, such as porosity, to the lunar soil sample and sufficient amounts, for example, a total of 10 standard samples used in their study [2]. Additionally, ground instruments are required to conduct the measurement under environmental conditions similar to those on the Moon and have the same working status as the APXS on the Moon. The relative statistical errors resulted from the uncertainties of the peak areas, which are estimated to be <1–3% for Si, K, Ca, Ti, and Fe, <6% for Al, and <15% for Mg. The uncertainties of calibrations are not included upon analysis. (2) Ling et al., 2015 [3] used the method as follows. One obtained the peak-area ratio of measured samples and calibration target for each element by spectral curve fitting iteratively until convergence using GRAMS software, wherein the spectra underwent background removal. After that, the peak-area ratio was multiplied by the known concentration of the corresponding element in the calibration target. Hence, the elemental concentrations of the CE-3 soil samples were derived. Of note here is that their method is appropriate to the case in a simplified situation because it involved a series of effects during the measurement, such as the detector efficiency, the radioactive source strength, the collimator effect, and the surface effect. (3) Wang and Wang, 2015 [13] used the method that generally similar to Ling et al., 2015 [3], but deepened in three aspects: the fitting employed a sensitive nonlinear iterative peak-clipping method (SNIP) as the estimation of continuous background and a nonlinear least-squares fitting method (Hypermet function) to obtain the net area of each characteristic peak; by employing a finite element method, the design of APXS as wedge-shaped was taken into account that the generated fluorescent X-ray is obstructed by the collimator; the correction for surface effects was taken into consideration by increasing the measured characteristic peak area of elements Mg–Cr by 15%, as provided by an evaluation through Monte-Carlo technique in Wu, 2012 [14], since the X-ray fluorescence intensity changes with respect to the irregular surface of the Moon, though the chemical composition of the calibration target is constant, specifically, the relatively low X-ray energies would significantly decline compared to X-rays with higher energies, and the effect is obvious in the circumstances of large particle size and/or phase angle [15,16,17].
Additionally, we note that the relative errors of the low Z elements are supposedly larger than that of the other relatively high Z elements due to some extent to the limitation of the energy resolution of the APXS, but the results of both Refs. [3,13] show a contrary case in their relative errors of MgO and FeO. Moreover, as pointed out by Wang and Wang, 2015 [13], the content of FeO might be evaluated higher than that of the real situation because of an estimation of continuous background by the SNIP method. We add that the content of TiO has the same effect in the case too. The determination of the spectrum for the silicon drift detector is a crucial step for the derivation of the major elements concentrations. In the APXS spectrum, it is necessary to account for the asymmetric tail at the low-energy side of the characteristic peak, i.e., tailing effect. This tail includes the exponential tail and the shelf tail, and is detector specific (e.g., thickness, dead layer, front contact composition, sample-source-detector geometry, and collimator). The exponential tail is caused by a known effect in X-ray spectroscopy, called incomplete charge collection (ICC). The shelf tail structure, on the other hand, particularly arises from Compton scattering X-rays and possible radiative Auger effect (RAE), and its contribution is generally considered part of the background. It is noted here that the shortcomings of the SNIP method for estimating background is discussed in detail at the end of Section 2.2. The asymmetric tail cannot be described by a simple analytical function (cf. Equations (4) and (5)) [18,19,20,21]. If the tail contribution is neglected, it gives rise to uncertainties in the spectrum fit because of the superposition with the continuous background, which affects the estimation of those chemical contents when their elemental peaks are superimposed by the low-energy shelf tail of a major peak [18].
In Table 1, we compare the three different analysis results of the major elements concentrations, the percentage differences are calculated as = (B − A)/A × 100% and = (C − A)/A × 100%, where the A, B and C are the results of Zhang et al., 2015 [2], Ling et al., 2015 [3] and Wang and Wang, 2015 [13], respectively. In the case of LS1, the events were recorded in 2BCE3-0006, which contains two measurements that are proper to analyze separately as two spectra. Due to the sampling sites being apart laterally about 10 cm distance, and although the spectra in Figure 4 show similar chemical elements concentrations for both sites, there is a slight difference in the counting rates. In addition, the results of both Refs. [2,13] hold a consistency in the fact that LS1 and LS2 have similar chemical elements concentrations. If the results regarding both LS1 and LS2 of Ref. [2] compare with that of both Refs. [3,13], it shows large differences and . As described above, the determination of the content of high Z elements such as TiO and FeO were deviated that of the real situation. Also, if the results regarding both LS1 and LS2 of Ref. [13] compare to that of Ref. [3], it almost overlaps together other than the content of MgO in LS2. As stated above, it indicates that scrutinizing the data to derive a more precise result also assists in understanding the geochemical characteristics of the young lunar samples in CE-3 landing site. Besides, we add that the total sums of chemical components in Ref. [2] are 100 wt.%, while the compositional data in Ref. [3] are normalized to 99 wt.% on account of the missing elements (Cr, Mn, Na, and P) in the analysis. Similarly, the total sums of the results in Ref. [13] are ~99 wt.% due to inability to detect the missing elements.
In this paper, we posit to employ an optimized model for the derivation of major elements concentrations directly with the advantages of reliability and being independent of calibration by ground standards. In addition, it is significant that the surface modeling of particle size effect in X-ray fluorescence is performed for correction in the elemental analysis because there are only a few studies where the particle size effect applies to the actual measurement on the lunar surface regardless of remote sensing or in-situ detection. Our method may facilitate data analysis in future space exploration missions. The paper is organized in the following manner. We will describe the APXS instruments and data descriptions in Section 2.1, and present the detail of our model for the derivation of major elements concentrations in Section 2.2, Section 2.3 and Section 2.4, followed by our results in Section 3.1 and an analysis of the difference between the results of the previous lunar missions in Section 3.2. Discussion is held in Section 4 and the conclusions are presented in Section 5.
2. Materials and Methods
2.1. Instruments and Data Descriptions
The APXS system, the only payload on the robotic arm of the Yutu rover, was designed to investigate the in-situ chemical compositions of lunar soil, sampling the roving area along Yutu’s track (see Figure 1 in [8], in which the white dots indicate positions where APXS conducted in-situ measurements). It conducts the measurements of the intensities of characteristic fluorescent X-rays produced by interactions of lunar soil samples with incident X-rays [22]. The measured energy range of APXS is from 0.4 keV to 22 keV. APXS was deployed four Fe (~253.3 mCi in total, on-orbit) and four Cd (~9.34 mCi in total, on-orbit) as radioactive sources [22,23]. The collimator of radioactive sources has a diameter of 6 mm. Table 2 gives the energy and relative intensity of characteristic X-rays emitting from radioactive sources [24]. The geometry and working principle of APXS is shown in Figure 2. The calibrated energy resolution of APXS is about 135–142 [email protected] keV K line of Mn (at 20 C), which allows the K lines of elements (Z = 12–41), particularly the low Z elements, to be resolved. The X-ray emission from the lunar soil can be detected by APXS Silicon Drift Detector (SDD; 7 mm active areas) within a circular region with a diameter of ~50 mm on the Moon’s surface, which is called an effective detection area [25], and then collected in a spectrum with 2048 ADC channels during 8 s of integration [26]. A calibration target with a basalt rock sheet (20 mm × 5 mm) is utilized to check the inflight performances of APXS before each detection. The elemental concentrations of the calibration target are listed in Table 3 [22]. The K lines for the major elements Mg, Al, Si, Ca, Ti, and Fe on the lunar surface were expected to be detected during the exploration process.
This study is based on level-2B APXS data available from the Ground and Research Application System (GRAS) of the Chang’E-3 Project [27]. In level-2B data, energy calibration, work distance correction, correction for the effect of temperature, and dead time correction have been carried out. Before further data processing, the spectrum contains 2048 ADC channels, but channels 1 and 2048 are not particularly valid data and therefore have been eliminated. Additionally, any data with a “quality state” value other than “0” has been excluded. Table S1 lists the file IDs of CE-3 APXS data used in this study. APXS has successfully performed two measurements (2BCE3-0005 and 2BCE3-0007) on the calibration target on 22 December 2013 (UTC) and 11 January 2014 (UTC), respectively. Due to the poor signal-to-noise ratio, the measurement of the calibration target 2BCE3-0005 is not included in the analysis. The calibration mode on 11 January 2014 (UTC) took 2128 s, as shown in Figure 3. Prominent Cu and Ni characteristic peaks are mainly from the materials in the collimator and target holder or a target frame. Two soil samples (2BCE3-0006, hereinafter referred to as LS1_1 and LS1_2) were measured on 24 December 2013 (UTC), around the landing site in 2768 and 2032 s, respectively. The lateral distance between the two soil samples is about 10 cm. The vertical distance is 2–3 cm from the APXS Silicon Drift Detector (SDD) to the lunar surface of the regolith. Two measured energy spectra of LS1_1 and LS1_2 (2BCE3-0006) are shown in Figure 4 (counts are normalized by integration time), characteristic peaks of Mg, Al, Si, K, Ca, Ti, Cr, Mn, Fe, Ni, Cu, Sr, and Zr could be clearly seen. The counting rates of characteristic peaks from major lunar elements such as Ca, Ti, and Si from the two spectra (LS1_1 and LS1_2) are different, which is mainly caused by different vertical distances of the SDD to the samples. However, the shapes of the two spectra are similar, indicating similar chemical compositions of the two soil samples. The counting rates of Cu and Ni characteristic peaks are almost the same because Cu and Ni peaks are mainly from detector materials, and thus counting rates of them do not depend on the distance of the detector to the measured samples. It indicates the stable performance of APXS at different times and working temperatures since the mean counting rate of Cu almost does not change in the two measurements. The measurement of the third lunar soil sample (2BCE3-0008, hereinafter referred to as LS2) on the following lunar day was conducted in a 1-h (3632 s) period on 14 January 2014 (UTC), and its measured energy spectrum is shown in Figure 5. Table 4 summarizes the measurements with the identifier, location and time in this study.
In general, we follow the procedure described in Gellert et al., 2006 [28] to analyze the APXS spectra (Figure 3, Figure 4 and Figure 5), where the corresponding name of element lines are denoted. The essential step to derive the elemental concentrations of lunar soil samples in the CE-3 landing site is to extract the peak area of each characteristic element line from the X-ray energy spectrum. The peak fit routine is tailored for the APXS spectrum based on the fitting model (see Section 2.2). Using the calibration relationship expressed in Equations (8) and (9), one can obtain the parameters that describe the detector properties such as the energy calibration, peak form, and energy resolution, reflecting the radioactive source strength, peak broadening due to higher temperature, detector efficiency, the sample-source-detector geometry, and the radiation environment [28]. Then, the peak areas are correspondingly converted into elemental oxide concentrations for the subsequent analysis. The iterative procedure of the Fundamental Parameter method to derive the concentrations of major elements is described in Section 2.4. In terms of statistical errors, these are calculated from the peak area errors, which only represent the precision of the analysis, and uncertainties of calibration are not included [28].
2.2. Spectrum Fitting
Generally, the APXS spectrum can be well described by the Hypermet function (Bertol et al., 2018 [18]), firstly developed by Phillips and Marlow, 1976 [29]. The total spectrum fitting function has the form:
The model expresses the detector response function as
where these components are considered as the following forms:
(I) The Gaussian main peak:
(II) The exponential tail (modified form for computation [30]):
(III) The low energy shelf:
(IV) The escape peak:
In this model, we use a polynomial background as the following:
where H’s represents the height of the various components, x is the channel number, is the Gaussian centroid, is the escape peak centroid, is the standard deviation of the Gaussian peak (FWHM = ), and is the decay constant of the exponential tail.
As shown in Figure 3, Figure 4 and Figure 5, the spectra obtained by APXS have a continuous background and Gaussian distributions, which are characteristic peaks, escape peaks and backscattering peaks. The peaks are superimposed on a continuous background, which is produced by Rayleigh and/or Compton scattering X-rays and secondary electron bremsstrahlung radiation processes, which are related to the radioactive sources, the sample, and the sample-source-detector layout. The shape of background consists of a polynomial function and multiple low energy shelf functions (or called step functions). The characteristic peaks were considered from magnesium to zinc both of the K and/or K peaks, covering a 1 keV to 10 keV photon energy range. The peaks have an exponential tailing at the low-energy sides, which is caused by incomplete charge collection (ICC) in the detector when the photon attenuation coefficient for energies above the Si K edge [20,21]. It should be noted that this tailing has to be taken into account as a part of the Gaussian peak area for the correction of the peaks overlapping. Due to the crystalline silicon materials used in the detector of APXS, the characteristic SiK X-rays that are produced during the photon energy-to-charge conversion process can sometimes escape the active detector volume with a statistical probability, particularly when the generation of X-rays near the detector surface, resulting in a new “escape” peak that appears at an energy of SiK lower than that of the parent peak. In terms of the peaks overlapping, the corrections were taken into consideration in the analysis, for example, (1) the Cr-escape peak contributes to the Ca peak; (2) the Fe-escape peak closely overlaps with the Ti peak, some parameters were assigned as constraints, such as the ratio of Gaussian main peak to escape peak, and the ratio of K peak to K peak [26,28]; (3) the scattering peaks of the Fe source (Fe scatters) overlap the Mn peaks, indicating the concentration of Mn in the sample was not able to determine because of being regarded as contamination in the analysis.
In summary, the fitting analysis includes the elemental characteristic K and/or K peaks, which are described by Gaussian distribution. Each peak, which has a characteristic energy greater than the Si K edge, has been assigned an escape peak. The low-energy sides of the major peaks have taken the tailing (exponential and/or shelf tail) into account for the peaks overlapping correction. Background contributions and electronic noises are considered, and the peaks overlapping are corrected in the fitting analysis.
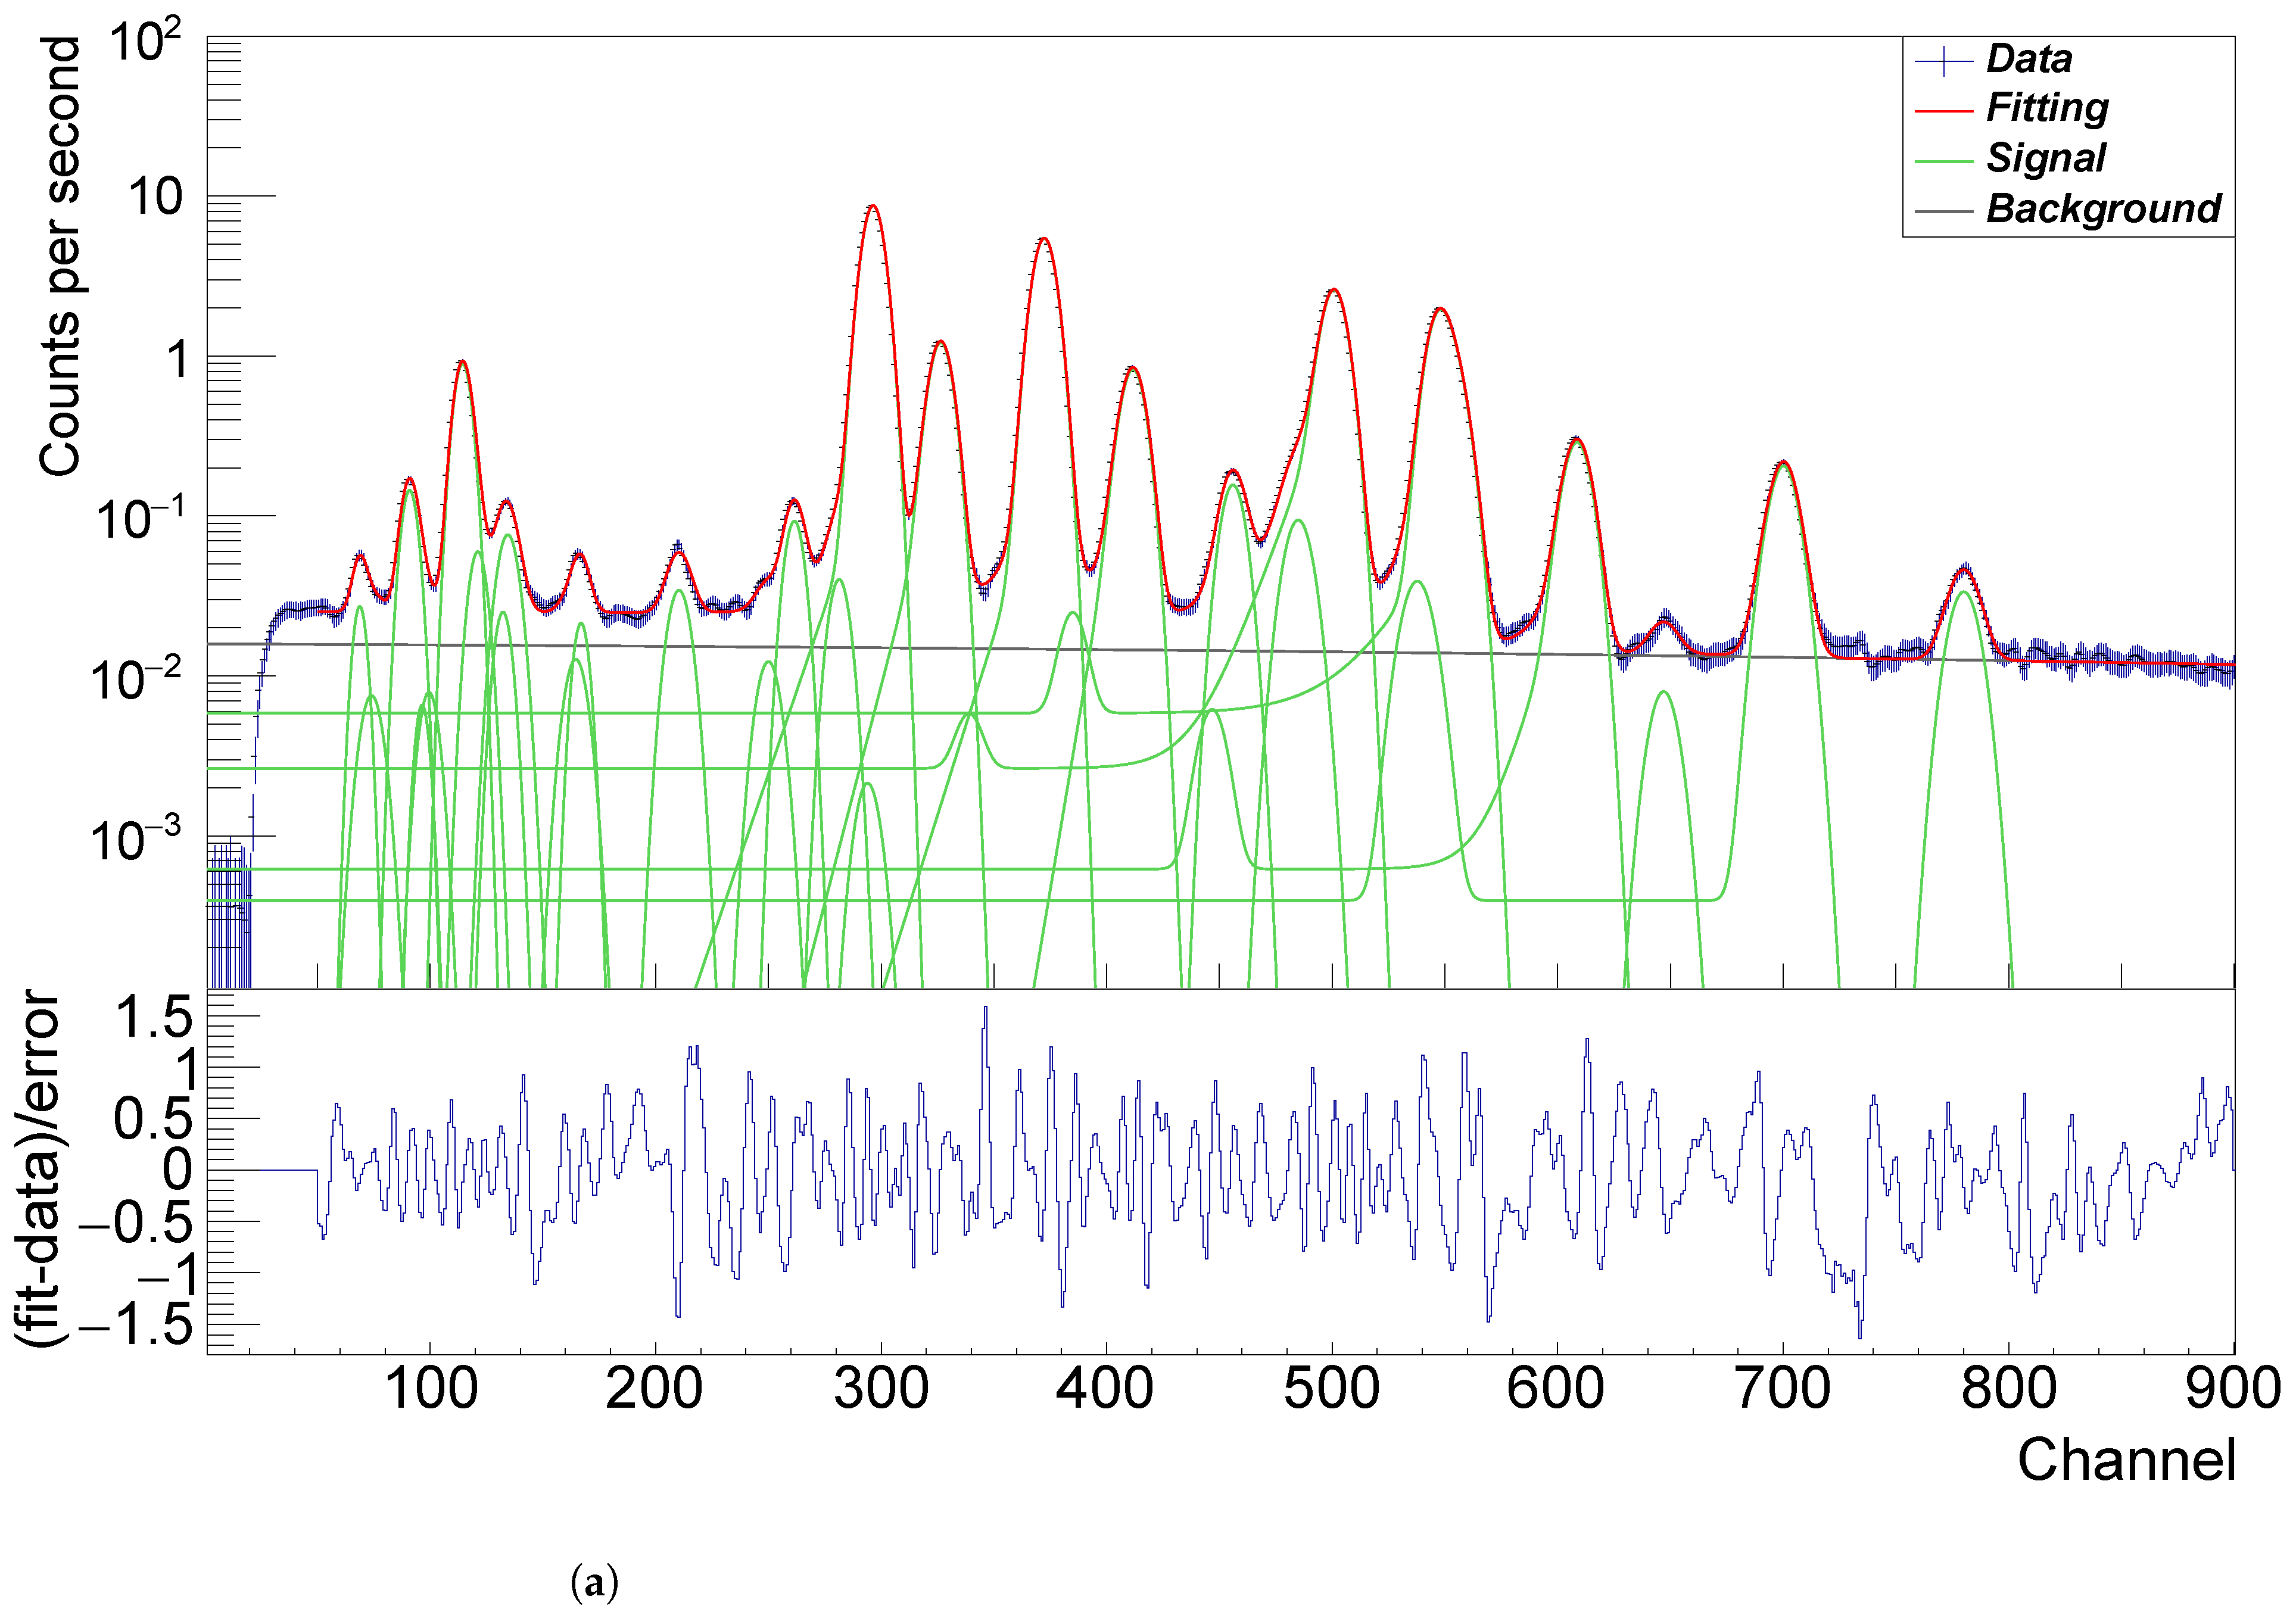
The peak fit routine, based on the data analysis framework of ROOT software [31] through a global fit with minimum method, has been developed for fitting the parameters of the function to disentangle different components in the measured APXS spectra. One could extract the contribution of each component from an energy spectrum, namely, obtaining the measured intensity of fluorescent X-rays (the peak areas). The fitting results are shown in the upper part of each panel of Figure 6. Correspondingly, the residuals of the fits (), defined by the ratio of the difference between the fitting result and measurement data to measurement error, are plotted in the bottom part of each panel of Figure 6, The fitting results are indicated within , reflecting the spectra fitting are performed successfully.
The spectrometer response has the following linear relationships between (1) X-ray energy and channel number; (2) full-width-at-half-maximum (energy resolution) and X-ray energy:
where Chn is the channel number. k, , F, are the fitting parameters: k is the energy per channel, is the energy at zero, F contains the Fano factor, is the full-width-at-half-maximum (energy resolution) at channel zero [28].
Spectrum fitting includes the determination of the detector properties, such as energy calibration, peak form, and full-width-at-half-maximum, which are the fitting parameters used to obtain the peak areas. Due to the tailing effect, the decay constant of the exponential tail, which is not shown in the above formula, takes into account as well [28]. This fitting process is performed for each measurement independently. Corresponding fitting parameters are shown in Table 5.
In addition, the detector response function describes the complex peak shape, which is consisted of three contributions: a Gaussian main peak, an escape peak, and an asymmetric (exponential and/or shelf) tail at the low energy side of the major peak, on the APXS spectrum. In Zhang et al., 2015 [2], the fitting was performed by Pseudo-Voigt functions with linear background removal to deconvolve the peak areas in the analysis. The contribution of escape peak for each element was neglected, but it should be taken into account as necessary for high accuracy determinations, as discussed above. In Ling et al., 2015 [3] and Wang and Wang, 2015 [13], the background was stripped and Gaussian functions were conducted to fit the peak shape. Of note here is that Wang and Wang, 2015 [13] also considered the exponential tail and the escape peak, but nevertheless the estimated background using the SNIP method may not be appropriately considered for the detector specifically since the X-ray fluorescence (XRF) background is generated by Rayleigh and/or Compton scattering X-rays. Particularly, Compton scattering results in appearing a feature in X-ray spectroscopy called Compton edge, which makes only a fraction of its full energy deposition by the active volume of the detector registered at the lower energy side in the spectrum. This part of events distributes with a break at the Compton edge, which causes the intensity decreases to the baseline height of the full energy peak, whose Compton distribution accumulated all together constitutes the background component, and therefore the background can be roughly considered as a straight line. As a result, the inaccurate background estimation leads to an evaluation of the content of components such as CaO and TiO higher than that of the real situation. It has been mentioned above that the peak is suggested to be described with an asymmetric tail at the low energy side [18], and the background can be considered as the sum of a linear/polynomial function and multiple low-energy shelf functions in the spectrum.
2.3. X-ray Fluorescence Theoretical Production Model
Based on the above spectrum fitting, the X-ray fluorescence intensity of various elements from the APXS measured spectra were obtained, it is possible to qualitatively derive the elemental concentrations based on the measured spectra of soil samples and those of the calibration target by the Fundamental Parameters (FP) Method (see Section 2.4). Since the relationship between the theoretical and measured X-ray fluorescence intensity is used in the FP method, the X-ray fluorescence theoretical production model is described in this section. For the details of the derivation, we refer the reader to Beckhoff, 2006 [32] and Rousseau, 2006 [33].
The intensities of characteristic fluorescent X-rays from the lunar surface are produced by interactions of the surface material with incident X-rays emitting from radioactive sources. Other contributions from Rayleigh and Compton scattering are negligible, as those intensities are too weak. Therefore, the theoretical X-ray fluorescence intensity for the characteristic line produced from an element i of the soil sample or calibration target, including the primary and secondary X-ray fluorescence, is given in Equation (10). Table 6 shows the references to the fundamental parameters used in the following formulas.
The primary X-ray fluorescence generated from an element i in the soil sample or calibration target (denoted as S in this section) is excited when the incident energy is greater than the absorption edge energy of an element i. is expressed in Equation (11). Subsequently, the primary X-ray fluorescence of an element j excites the secondary X-ray fluorescence of an analyte i as enhancement contribution , which can be calculated from Equation (12).
where is the intensity of incident X-ray from the radioactive source. and are the X-ray incident angle and X-ray emission angle to the normal direction of the sample or calibration target surface, respectively. The geometrical factor is described in Section 2.3.1. The detection efficiency of the silicon drift detector is described in Section 2.3.2. is the concentration of an element i. is the excitation factor of an element i. is the mass attenuation coefficient of an element i at energy . accounts for the total attenuation in the sample or calibration target S. The expressions are given in the following forms:
where is the K edge absorption jump ratio of an element i, and it has an approximation, given by Poehn et al., 1985 [34], of the jump ratio for the K-shell,
and is the fluorescence yield, which is a portion of absorbed X-rays to fluorescent X-rays for the shell whence the emission is excited from, of an element i. is the transition probability that the characteristic line of an element i will be emitted, and the enhancement term from an element j can be calculated from Equation (13), when the primary fluorescent energy of an element j is greater than the absorption edge energy of an element i (note that the definitions of symbols used in secondary X-ray fluorescence are similar to those of primary X-ray fluorescence).
where
and

Table 6.
References to the fundamental parameters.
| Definition | Parameter | Reference |
|---|---|---|
| Mass attenuation coefficient | XCOM (Berger et al., 2010 [35]) | |
| K edge absorption jump ratio | described in text. | |
| Fluorescence yield | Daoudi et al., 2015 [36] | |
| Transition probability | f | Scofield, 1974 [37] |
| Fluorescent X-ray energy | E | NIST (Deslattes et al., 2005 [38]) |
| Absorption edge energy | Poehn et al., 1985 [34] |
2.3.1. Geometrical Factor
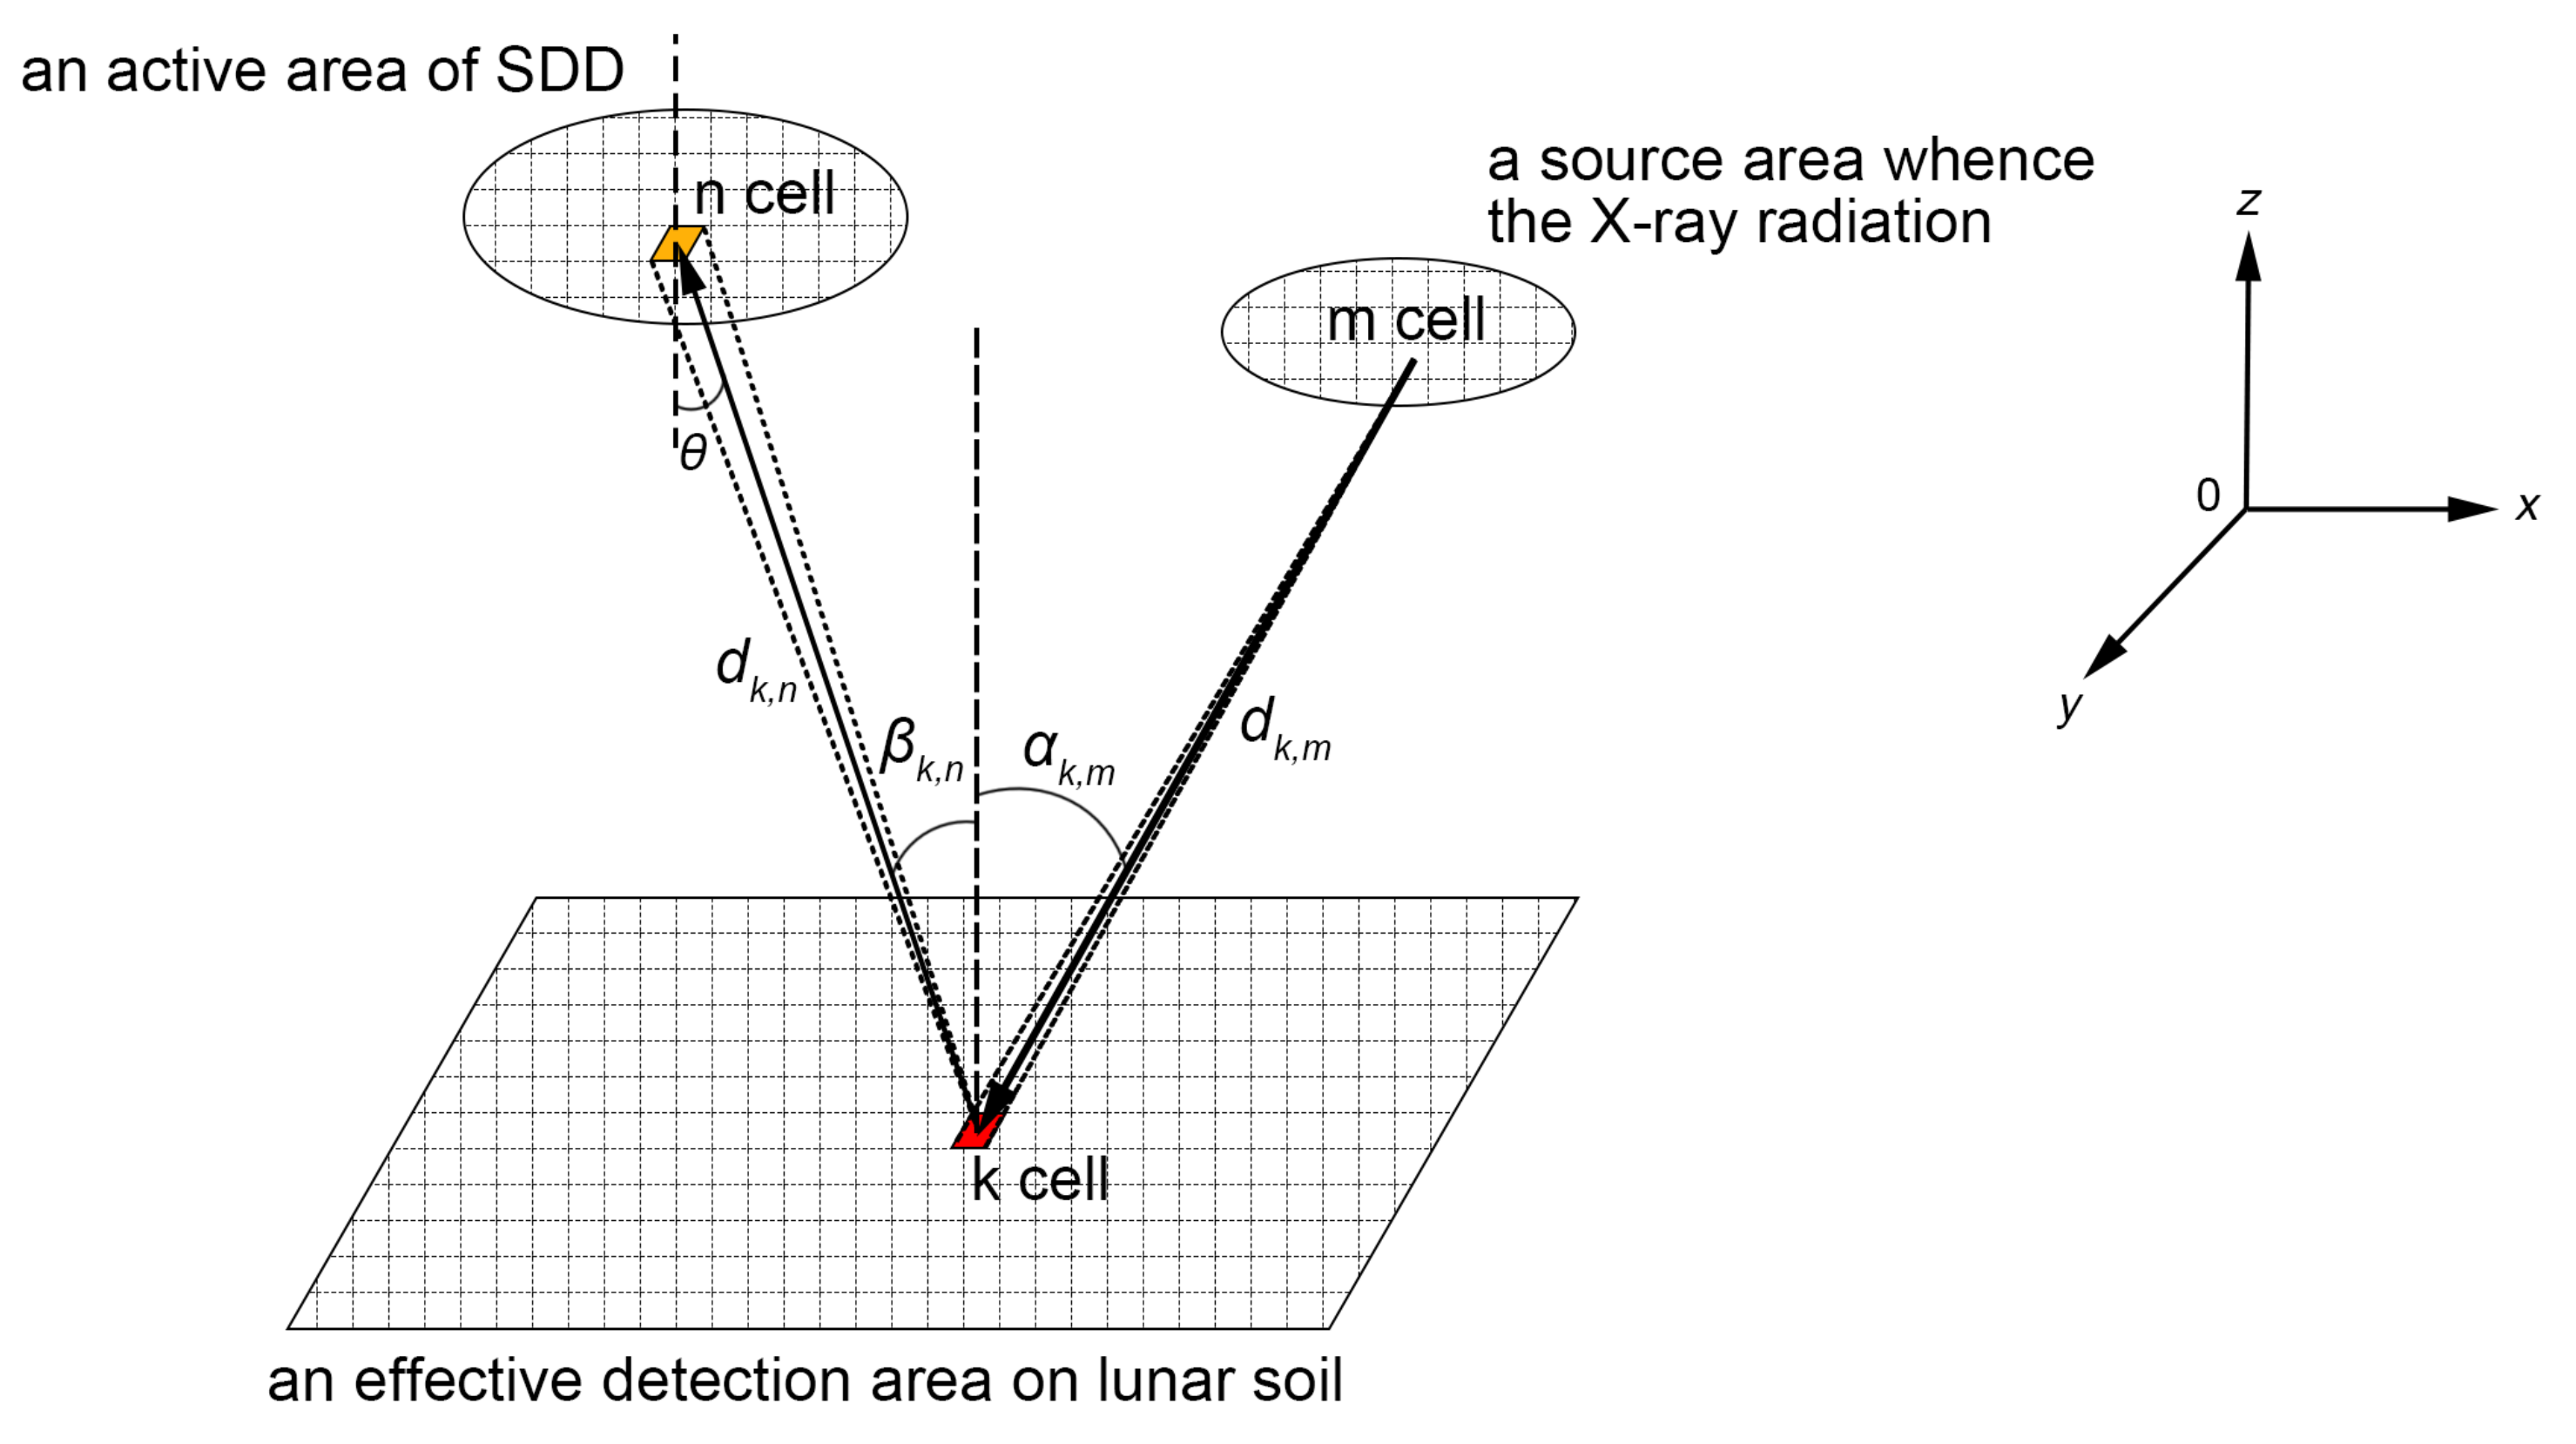
The fluorescent X-ray, which is excited by the incident X-ray emitting from radioactive sources, emanates isotropically from a certain location on lunar soil and is then received by SDD. Considering the geometry and the effect of collimators, the fluorescent X-ray that enters SDD is equivalent to the accumulated solid angle subtended by the irradiated portion of an active area of SDD, which is expressed in Equation (17). Also, the X-ray radiation that strikes lunar soil has a geometrical intensity distribution with respect to a source area whence the X-ray radiation. The fraction of incident X-ray is equivalent to a solid angle subtended by the irradiated portion of an effective detection area on lunar soil, which is expressed in Equation (18). To compute the solid angle on account of the geometry and the effects of collimators, we decompose these areas into equally sized grid cells, as shown in Figure 7. Note, the geometrical parameters of APXS mentioned above are described in Section 2.1 and summarized in Table 7.
Categorizing the grid cells for , we then calculate the weight according to as the geometrical factor:
2.3.2. Detection Efficiency Calibration
The theoretical X-ray detection efficiency of the detector (refer to Beckhoff, 2006 [32] for the details), which is included in Equation (11) as the calibration for calculating the theoretical X-ray fluorescence intensity, is determined according to the detector component, the type of its structural layers, the geometry of the detection system, and the responsivity for the detection system. In the case of the application of APXS silicon drift detector (SDD), the function of detection efficiency is given in general form by Equation (20), and the corresponding parameters are summarized from Wu, 2012 [14] in Table 8, also see Figure 2 for a geometric layout of the APXS payload.
where is the detection efficiency of SDD for fluorescent X-ray energy emitted by an element i that enters to the detector with the incidence angle .
The electronics system of APXS detector records events discretely, the dead time is defined as the time during which the instrument is unable to record another event, resulting in lowering the detection efficiency. The dead time includes the electronics response time and the software processing time. The input counting rate is about 800 cps, in which the pile-up effect is ignored. The electronics response time for the front-end and back-end electronics system of APXS are about 10 and 60 , respectively. Then the responsivity () of the front-end and back-end electronics systems of APXS are 0.992 and 0.954, respectively. Therefore, the synthetic responsivity of the detector is (see Wu, 2012 [14] for more details about the dead time and responsivity of APXS).
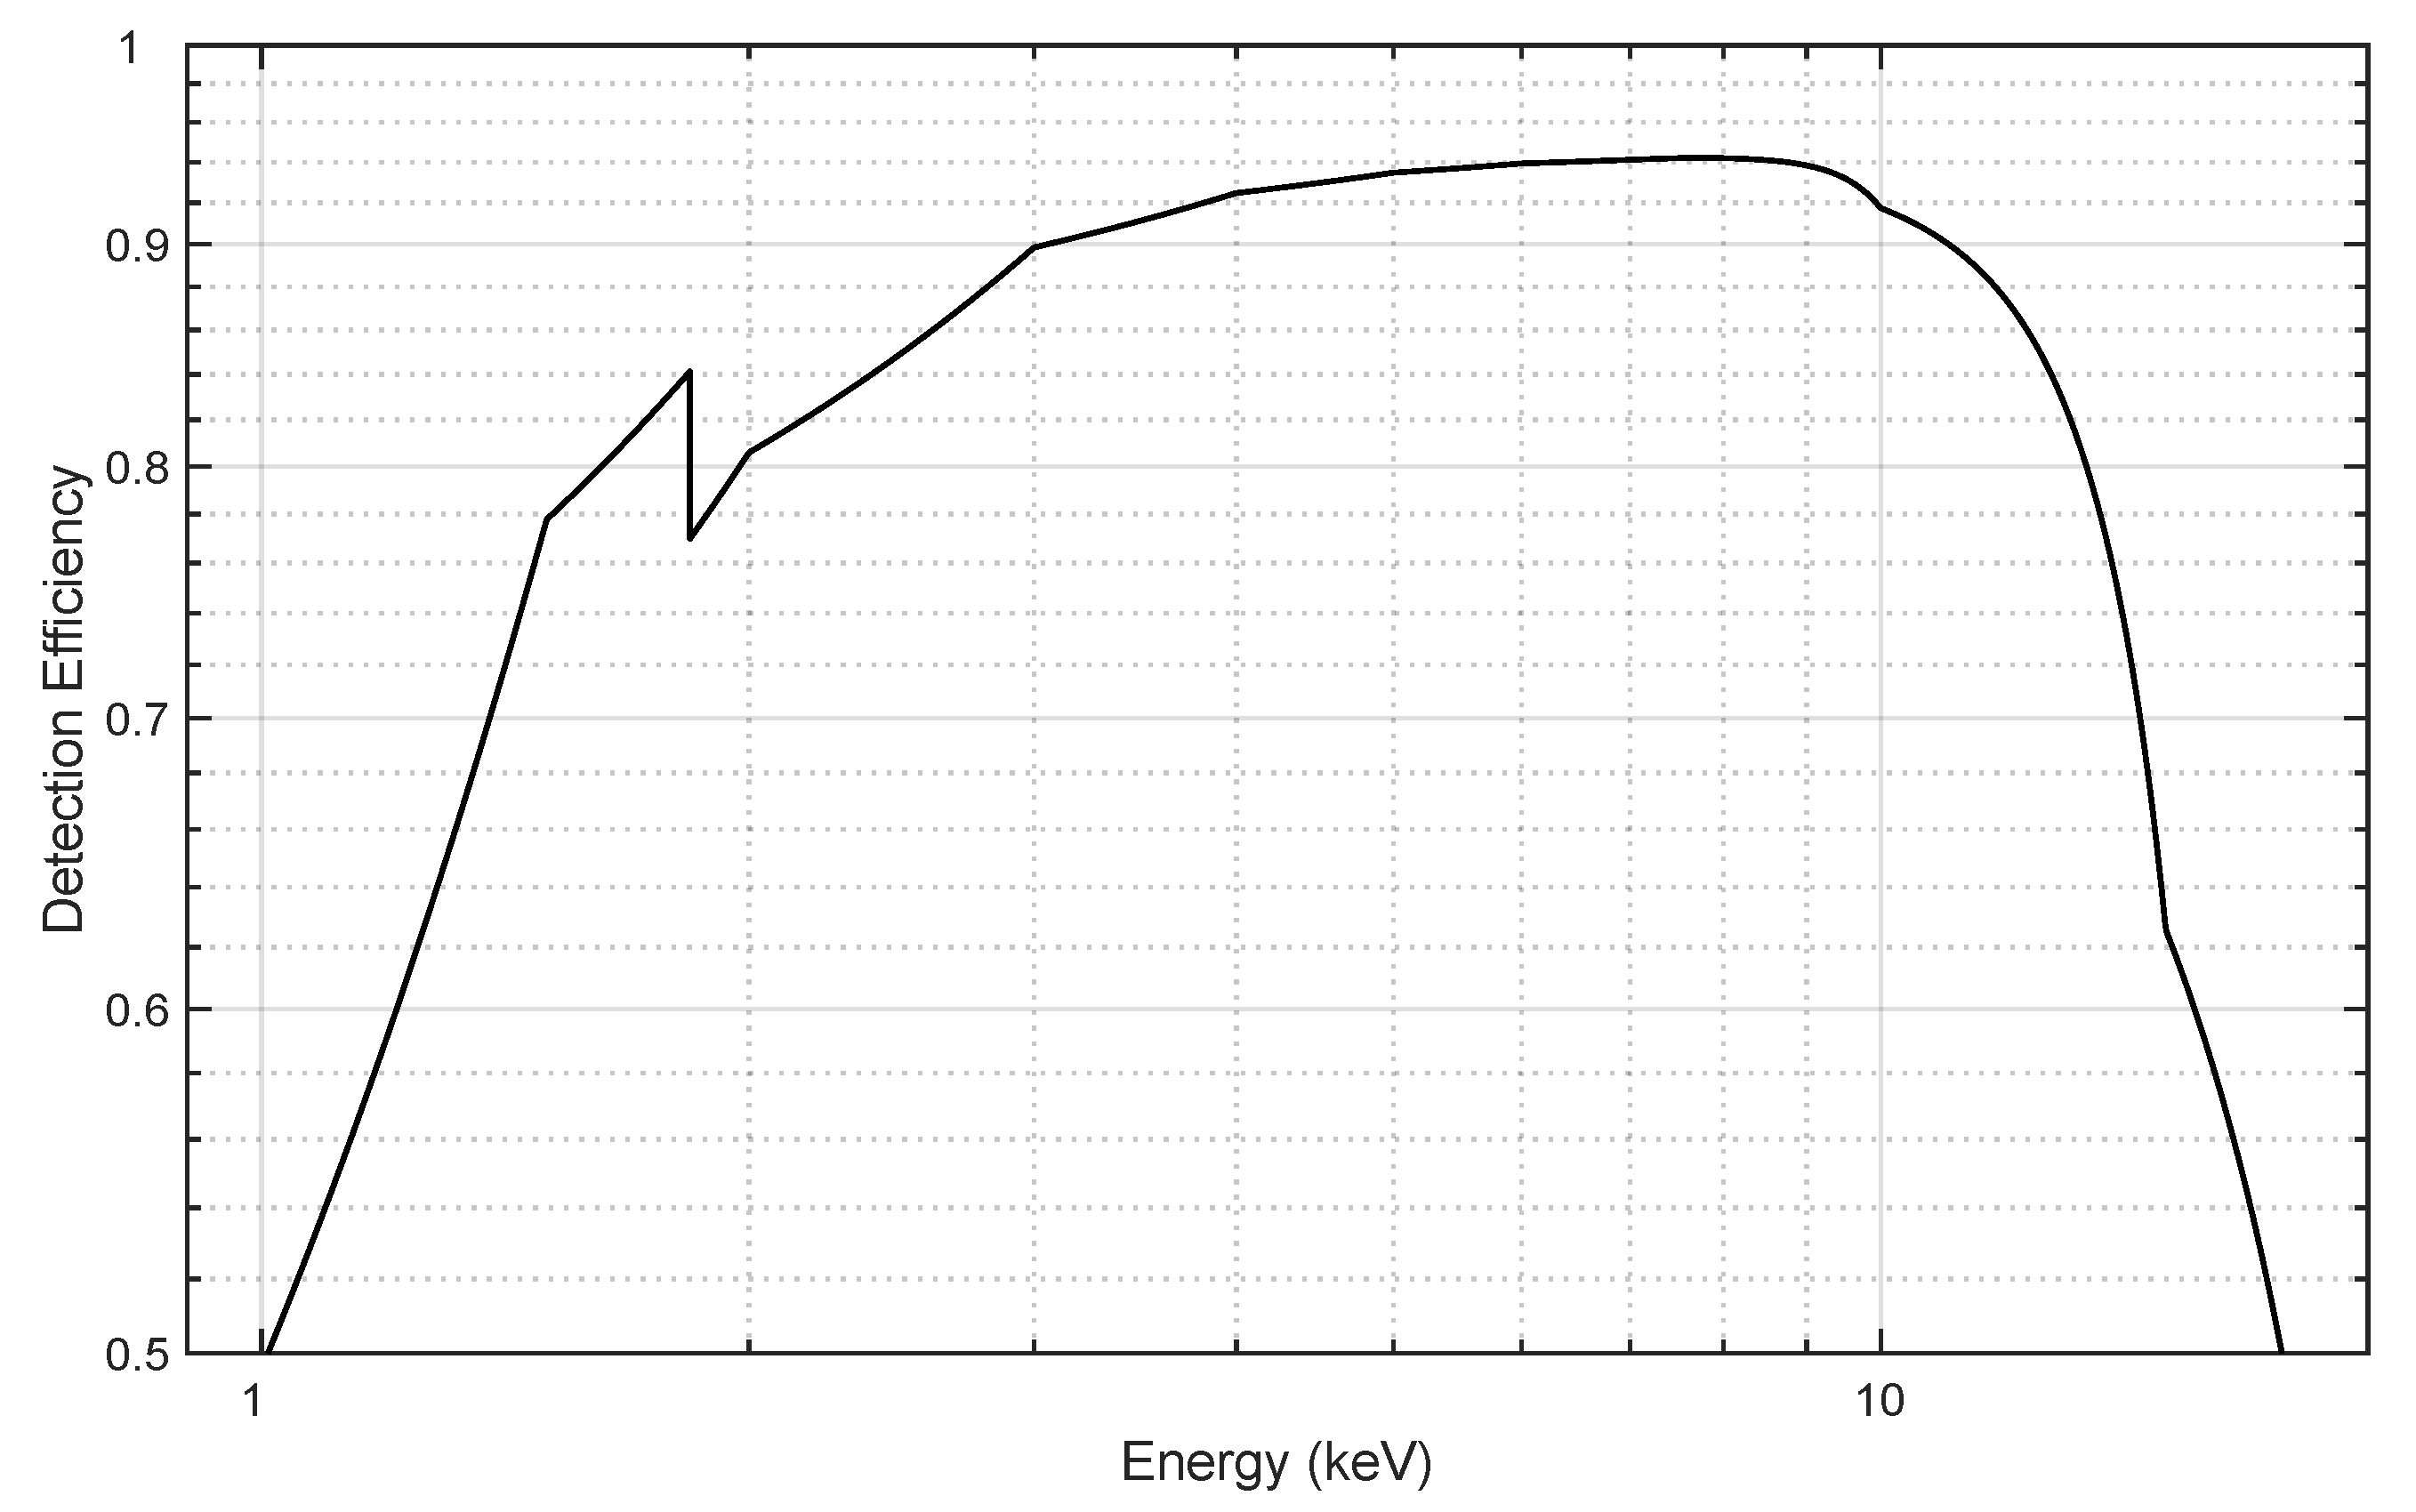
In the case of an incidence angle of and the synthetic responsivity of the detector , the X-ray detection efficiency curve of SDD is calculated in the energy range from 1 keV to 10 keV, as shown in Figure 8.
2.3.3. Surface Modeling of Particle Size Effect in X-ray Fluorescence
Overview
Given the compact powders were used as calibration target in APXS measurements, the effect of particle size in X-ray fluorescence with respect to the planetary surface (e.g., lunar regolith) should be taken into account, which has effect on the measured X-ray fluorescence intensities that the relatively low X-ray energies such as MgK, AlK and SiK lines significantly decrease compared to X-rays with higher energies such as TiK and FeK lines, and it is remarkable when observed at a larger particle size (≳ the transmission depth of X-ray fluorescence) and/or at larger phase angle [15,16,17].
Since the particle size effect was regarded as being due to the shadowing of X-ray incidence and the shielding of X-ray fluorescence by surface roughness [15,17], the surface roughness model, presented by Maruyama et al., 2008 [17], was described with a two-dimensional surface profile [15,17] (the reader is referred to Figure 4 in [17] for a detailed schematic), assuming that the surface roughness as rectangular wave functions, which are characterized by two parameters, half-wavelength W and amplitude H, respectively, for 25 < D < 500 , are given as: , and , where D is the particle size in diameter.
As for the lunar soil samples LS1_1 (LS1_2) and LS2 from the CE-3 landing site, we assume particle diameters of 45 m and 33 m, respectively. This value of D is determined by the effective diameter of the surface layer of the CE-3 landing site, which was obtained through in-situ optical measurements by the Panorama Cameras (PCAMs) onboard the Yutu rover of the CE-3 mission. The corresponding detailed works will be published, particular to the method used to extract the above mentioned particle size of the CE-3 landing site can be introduced here, which is based on reflectance phase function, with two parameters of reflectance and phase angle (cf. Xu et al., 2022 [39] and Jin et al., 2015 [40] for details). Besides, the plume from the lander erodes the regolith on the lunar surface during the landing, and therefore alters the nature of this surface. While comprehensive analysis can obtain the particle size distribution of the dust lifted in the erosion process, it is still not possible to extract the particle size distribution of the remaining dust on the surface that has undergone erosion, as demonstrated in You et al., 2021 [41]. Last but not least, as investigated by Wang et al., 2017 [42] through optical maturity (OMAT) index, this index can reflect, on the one hand, the space weathering effect (reddening of the spectra) of the lunar soil and indicates that the undisturbed soils of the CE-3 landing site are submature. The disturbance here refers to another effect resulted from the erosion of landing, as described subsequently. On the other hand, the plume from the lander resulted in different extents of erosion dependent on the lateral distance from the lander; thus, the location for Site5 [42] experienced the most disturbance (~25 m from the lander), while the soil sample LS2, corresponding to the location for Site8 [42], is suggestive of a minimally disturbed soil since it is the farthest away (~43 m) from the landing site and at the boundary of the diffuse blast zone [42,43]. The soil samples LS1_1 and LS1_2, corresponding to the location for Site6 [42], are located ~32 m from the lander; although it was not given in their analysis, we note that these soil samples have undergone some degree of surface erosion. This process removes the very fine, upper-most mature particles, leaving coarser, less mature, less porous, and denser materials on the surface [39,42]. Moreover, the analysis revealed that the maturity difference observed between the location for Site5 [42] and LS2 (Site8 [42]) can be attributed to a slightly higher abundance of submicroscopic metallic iron (SMFe) in LS2, indicative of the removal of fine, highly mature particles. As the location for Site5 [42] was only disturbed at a very shallow depth, affecting only the finest fraction of the regolith, this result implies that the upper-most surface has undergone significantly more weathering compared to the underlying material.
In addition to the surface roughness model established based on laboratory experiments by Maruyama et al., 2008 [17], a Monte-Carlo simulation was presented to investigate changes in X-ray fluorescence intensity on the irregular lunar surface by Wu, 2012 [14]. These theoretical estimations were also utilized in the study of Wang and Wang, 2015 [13], as described in detail in Section 1. Further discussion regarding the particle size effect is held in Section 4.
Numerical Calculation
We generally follow the two-dimensional surface profile (hereinafter referred to as “groove”) to develop the numerical calculation for the particle size effect in X-ray fluorescence, using the relation of W and H. The expression of primary X-ray fluorescence in Equation (11) is the form derived with the integration with respect to the thickness from zero to infinity. In the presence of a groove, the contribution of primary X-ray fluorescence is computed by the components given in the basic principle of radiation. Assuming that the fluorescent elements are piled up layer by layer in terms of the thickness of penetration depth and the groove surface, the computing procedure is depicted as a flow chart in Figure 9, where the definitions of symbols used in this section follow those in Section 2.3; k is the layer at which elements emit X-ray fluorescence. The grain density of lunar soil [44]: 3 g/cm is adapted in our calculation. is the segment of the penetration depth within a region of , typically is taken in our calculation for the integral , as an X-ray may emit variously to the groove surface depending on its depth of origin [45]. The penetration depth is considered as , i.e., the sums of the amplitude H and the transmission depth of X-ray fluorescence , where the amplitude makes the incident X-ray attenuated more when entering at the upper groove surface. is the portion below the groove surface of the emission path .
According to the particle size effect correction by numerical calculation applied in lunar X-ray fluorescence modeling, it improves the accuracy of the elemental analysis for the actual measurement and optimizes the model being capable of independence of calibration by ground standards. It may also extend our knowledge about the micro-scale surface features of the Moon (see Section 4).
2.4. Quantitative Analysis—Fundamental Parameter Method
The Fundamental Parameter (FP) method (see [46] and references therein) has been widely used in X-ray fluorescence analysis to qualitatively determine the elemental concentrations of a sample.
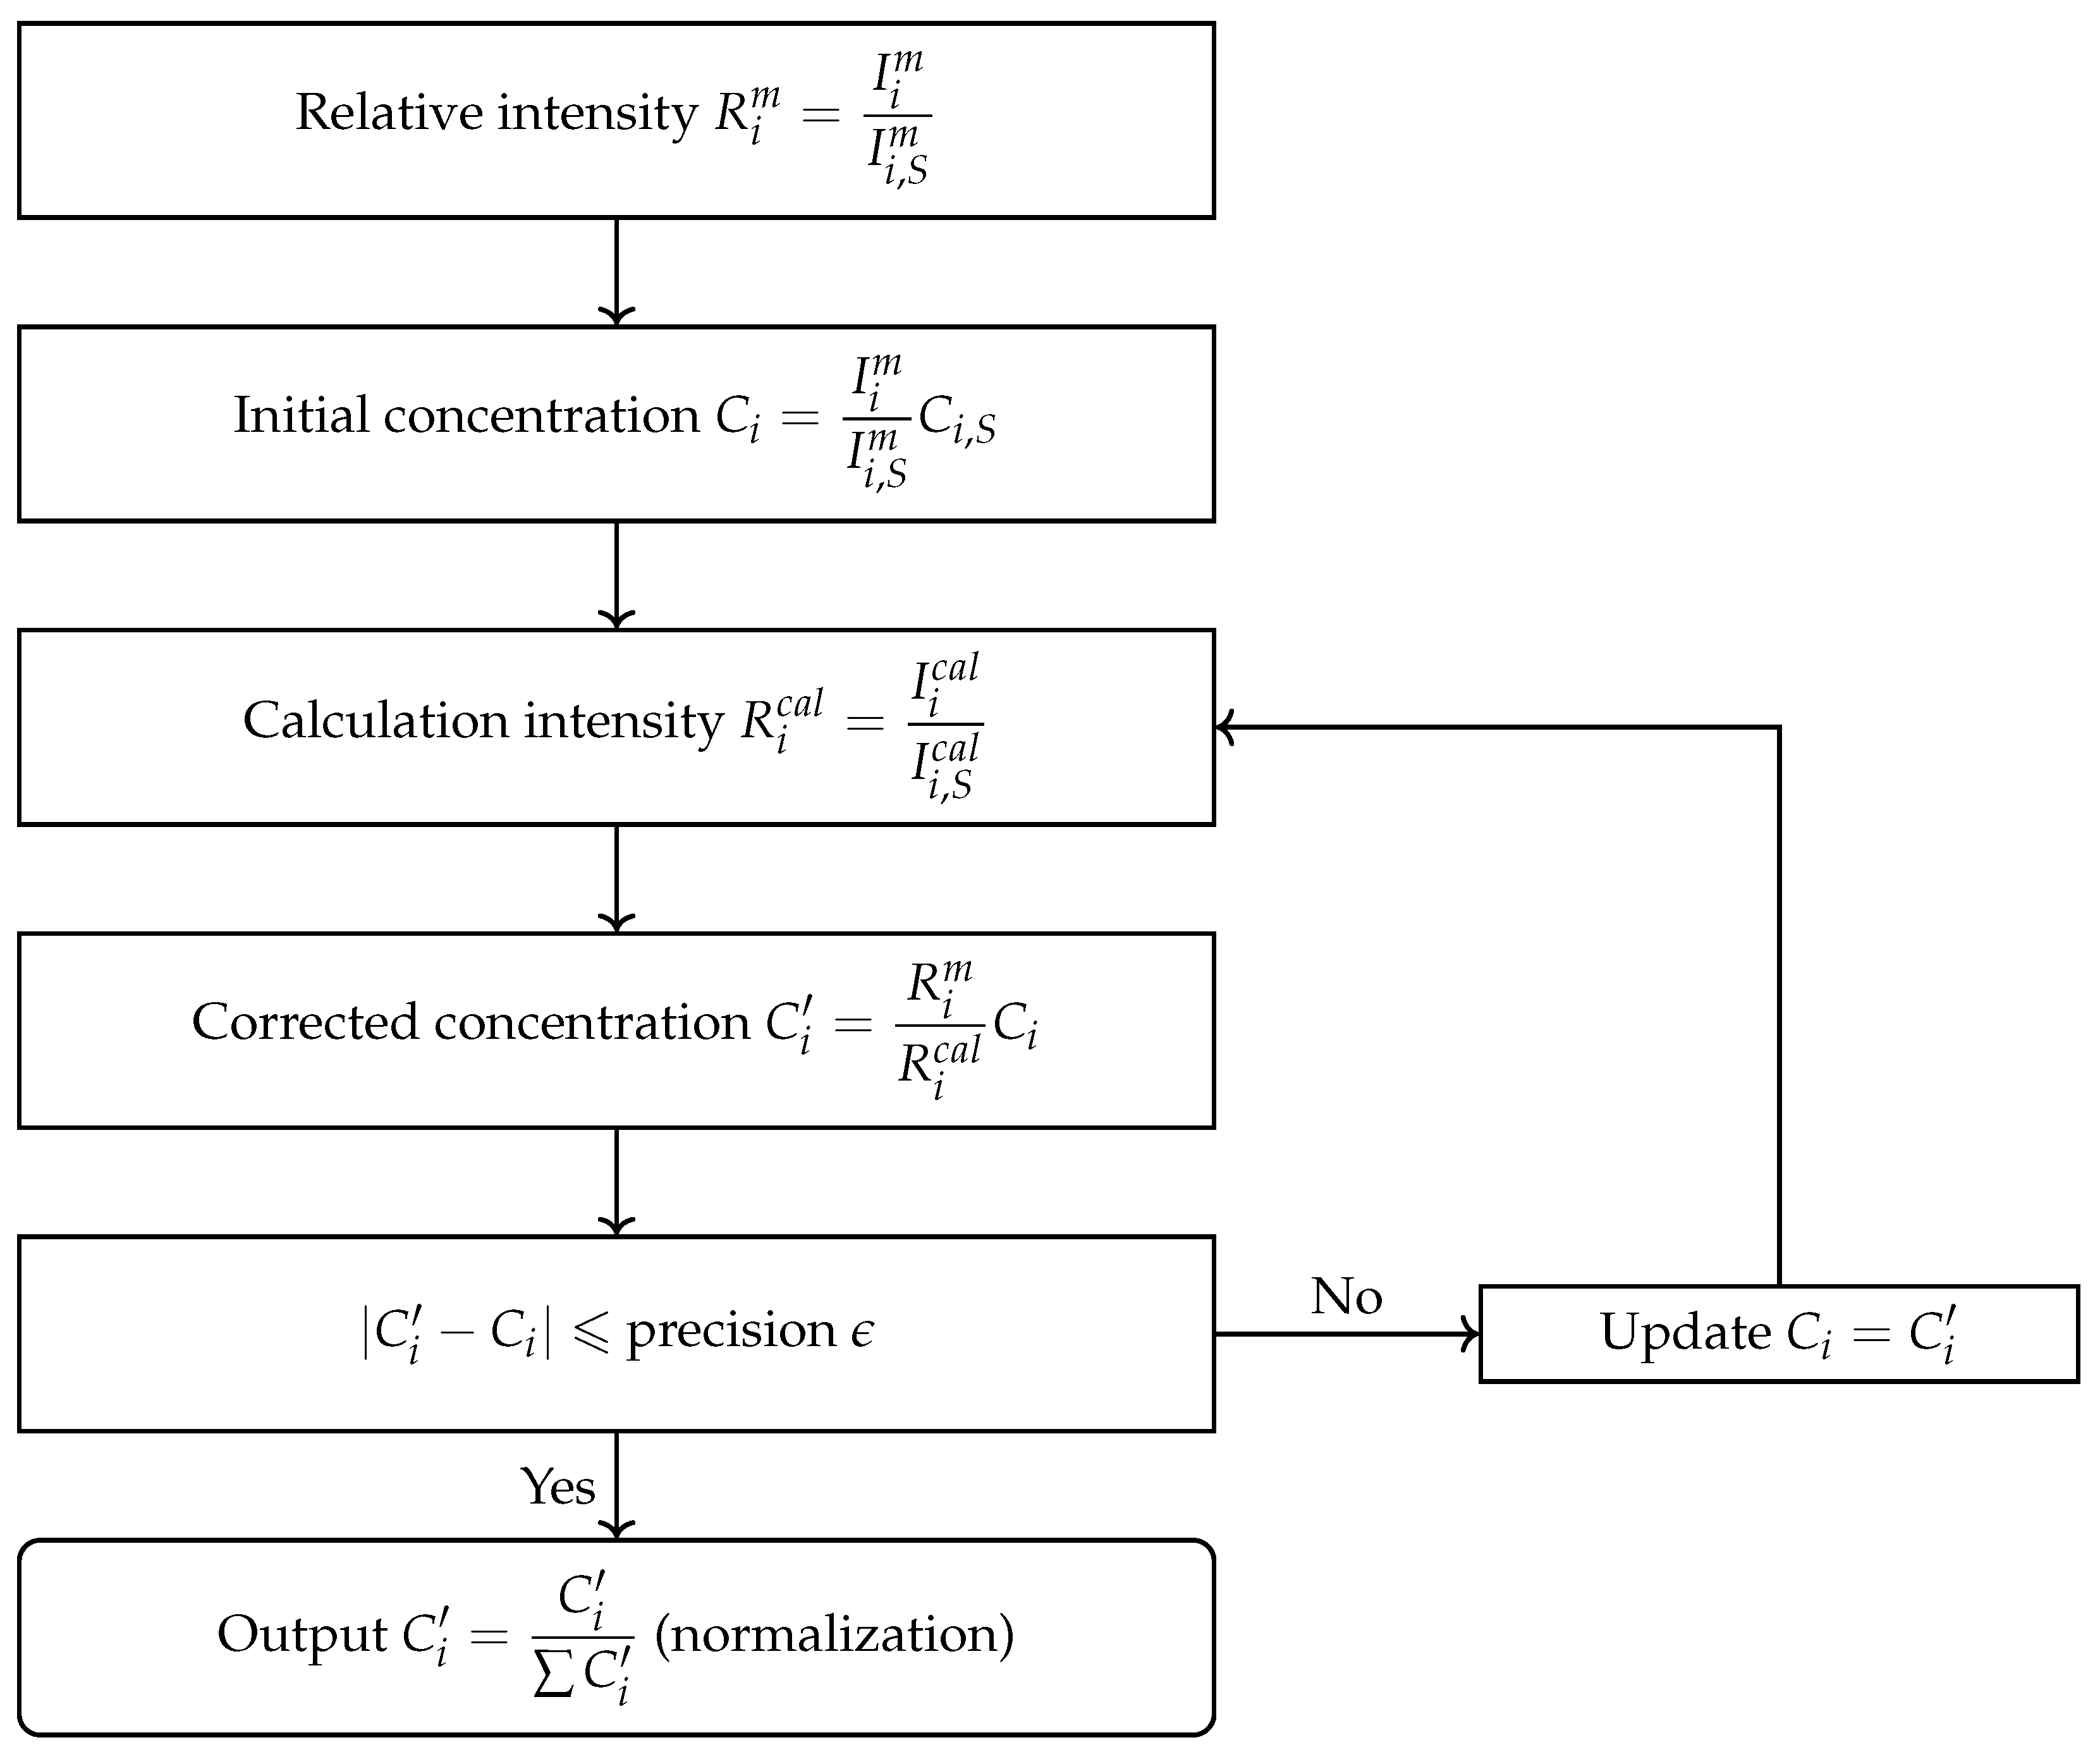
The iterative procedure of the FP method is shown in Figure 10. Assumed that, and are the measured fluorescent X-ray emission of an element i in the soil sample and the calibration target, respectively, and these parameters are derived by the spectrum fitting (see Section 2.2). and are the calculated fluorescent X-ray emission of an element i in the soil sample and the calibration target, respectively, and these parameters are obtained by the theoretical production model (see Section 2.3). is the concentration of an element i in the calibration target. In general, is the initial concentration for each element i as required for the iteration. And, these are used to calculate the X-ray fluorescence intensities of the calibration target and the soil sample separately by using the theoretical production model afterward. The iteration is continued by updating the concentrations using , and terminated until the difference between and is less than the precision . Therefore, it has no significant difference between the measured and theoretical relative intensities, i.e., if the measured spectrum is approximately consistent with the theoretical spectrum, then the elemental concentrations of the soil sample are determined. The results are shown in Section 3.1.
3. Results
The gamma-ray spectrometer of lunar prospector (LP-GRS) provides chemical measurements of the lunar surface from orbit. These measurements are based on the energy of the gamma rays emitted by the elements in the lunar surface. The depth sampled by gamma rays can reach several tens of centimeters, and it is determined by the energy of the detected gamma rays, which is dependent on the composition of the lunar surface elements being measured [10]. The in-situ detection of soil samples from the CE-3 landing site was successfully conducted using the X-ray fluorescence (XRF) method with the Active Particle-induced X-ray Spectrometer (APXS). This technique has a sampling depth estimated to be at the micron-scale, which is equivalent to the penetration depth of fluorescent X-rays. Furthermore, the surface of the soil samples has been eroded by the plume from the lander, which removed a certain depth of lunar dust from its surface.
As implementing the methods and taking into account all the effects as described above, the major elements concentrations of lunar soil samples from CE-3 landing site are determined from X-ray fluorescence intensities, with corrections applied for the particle size effect. The results are shown in Section 3.1.
3.1. Results of Chemical Compositions of Soil Samples in Chang’E-3 Landing Site
Table 9 gives the quantitative results of the chemical compositions of lunar soil samples in wt.%. The chemical compositions of soil samples LS1_1 and LS1_2 are consistent with each other within statistical uncertainties. This is expected since the distance of the distance between the two soil samples is about 10 cm. LS_2 is about 25 m away from LS1_1 (LS1_2), which is closer to the crater Zi Wei. Compared with LS1_1 (LS1_2), the measured elemental concentrations of LS2 vary slightly. Based on the above data of the three soil samples, we do not find a significant dependence of elemental concentrations on the distance from the rim of crater Zi Wei. In addition, the measured major elements concentrations from CE-3 APXS is consistent with orbital chemical compositional measurements from Lunar Prospector Gamma-ray Spectrometer (LP-GRS) in a broad region around CE-3 landing site, but with much better statistical and spatial resolution.
For validation purposes, we use the chemical compositions of our results listed in Table 9 to compare with those from previous studies [2,3,13]. It is evident from Figure 11a,b that the ratios of our results to those of Ref. [2] fall within the range of 0.9 to 1.1 for almost all chemical compositions. Our results show good agreement with that of Ref. [2], further supporting the reliability of our optimized model and results. Besides, the content of KO in soil sample LS1 from our results is more consistent with those of Refs. [3,13], rather than that of Ref. [2]. However, the contents of MgO and TiO in soil sample LS1 deviates significantly between our results and those of Refs. [3,13], as well as in the case of soil sample LS2 of Ref. [13]. Furthermore, as discussed in Section 4—(3), our results in Table A1 and Table A2 demonstrate that different particle sizes result in only slight variations of elemental concentrations in percent change. Therefore, there is no need for further validation.
3.2. Analysis of the Difference between the Results of the Previous Lunar Missions
The concentrations of AlO versus FeO, and AlO versus Mg# (molar ) in CE-3 landing site follow the systematics established with previously collected lunar soil samples from Apollo and Luna missions as well as lunar meteorites (see Figure 12). One can see from Figure 12 that CE-3 data approach the low AlO, small Mg#, and high FeO end in the correlation plot, suggesting a minimum mixture from other sources. The Mg# of the three soil samples is from 0.45–0.46. Such a small Mg# indicates the evolution of magma source is in a later stage.
In addition, the regolith samples reflect the material of the weathered layer of the ejecta blanket, which has an estimated depth ranging from 2.26 m to 2.46 m [50]. Especially, the soil sample LS2 is ~11 m away from a large bed rock, the so-called Loong rock (see Figure 1 in [8] and Figure 13). Loong rock is thought to be a coarse-crystalline basalt or dolerite excavated by the impact that formed the Zi Wei crater [8], which is distinct in texture from other lunar basalts or breccias samples from Apollo mission, making its chemical composition is of special interest. One may get some sense of the chemical compositions of Loong rock from soil sample LS2, since soil sample LS2 and Loong rock are close to each other and both sit on the ejecta blanket of crater Zi Wei.
As shown in Figure 14, CE-3 data show a high FeO and low-intermediate TiO concentration, which sit in a (new) region apart from previous in-situ or laboratory detection of lunar regolith samples (but for the latest returned samples from CE-5 [49] being in an adjacent location, as marked in Figure 14) and broadens the range of lunar basalt types. If one compares the in-situ or laboratory detection data with remote sensing data from LP-GRS, a clear deviation of Fe-Ti distribution pattern could be found between Apollo 11 & 17 data and LP-GRS data, especially in the region with high FeO concentrations; however, CE-3 data sit well on the trend established by LP-GRS data. Thus, this deviation may indicate the unusual petrological characteristics involved in the soil samples. Also, there are plenty of LP data points sitting around CE-3 region, e.g., the data points of western Procellarum and Imbrium (WPI: a region includes western Procellarum and extends into Imbrium, which has an abundance of FeO of higher than 18 wt.% and was defined by Prettyman et al., 2006 [10]. Within this region, to avoid ambiguity due to the CE-3 landing site being in northern Mare Imbrium, the WPI is distinguished by a separation between the portion of Imbrium and the portion of western Procellarum, as denoted by blue and black dots, respectively. Namely, there are both black and blue dots surrounding the CE-3 data in Figure 14).
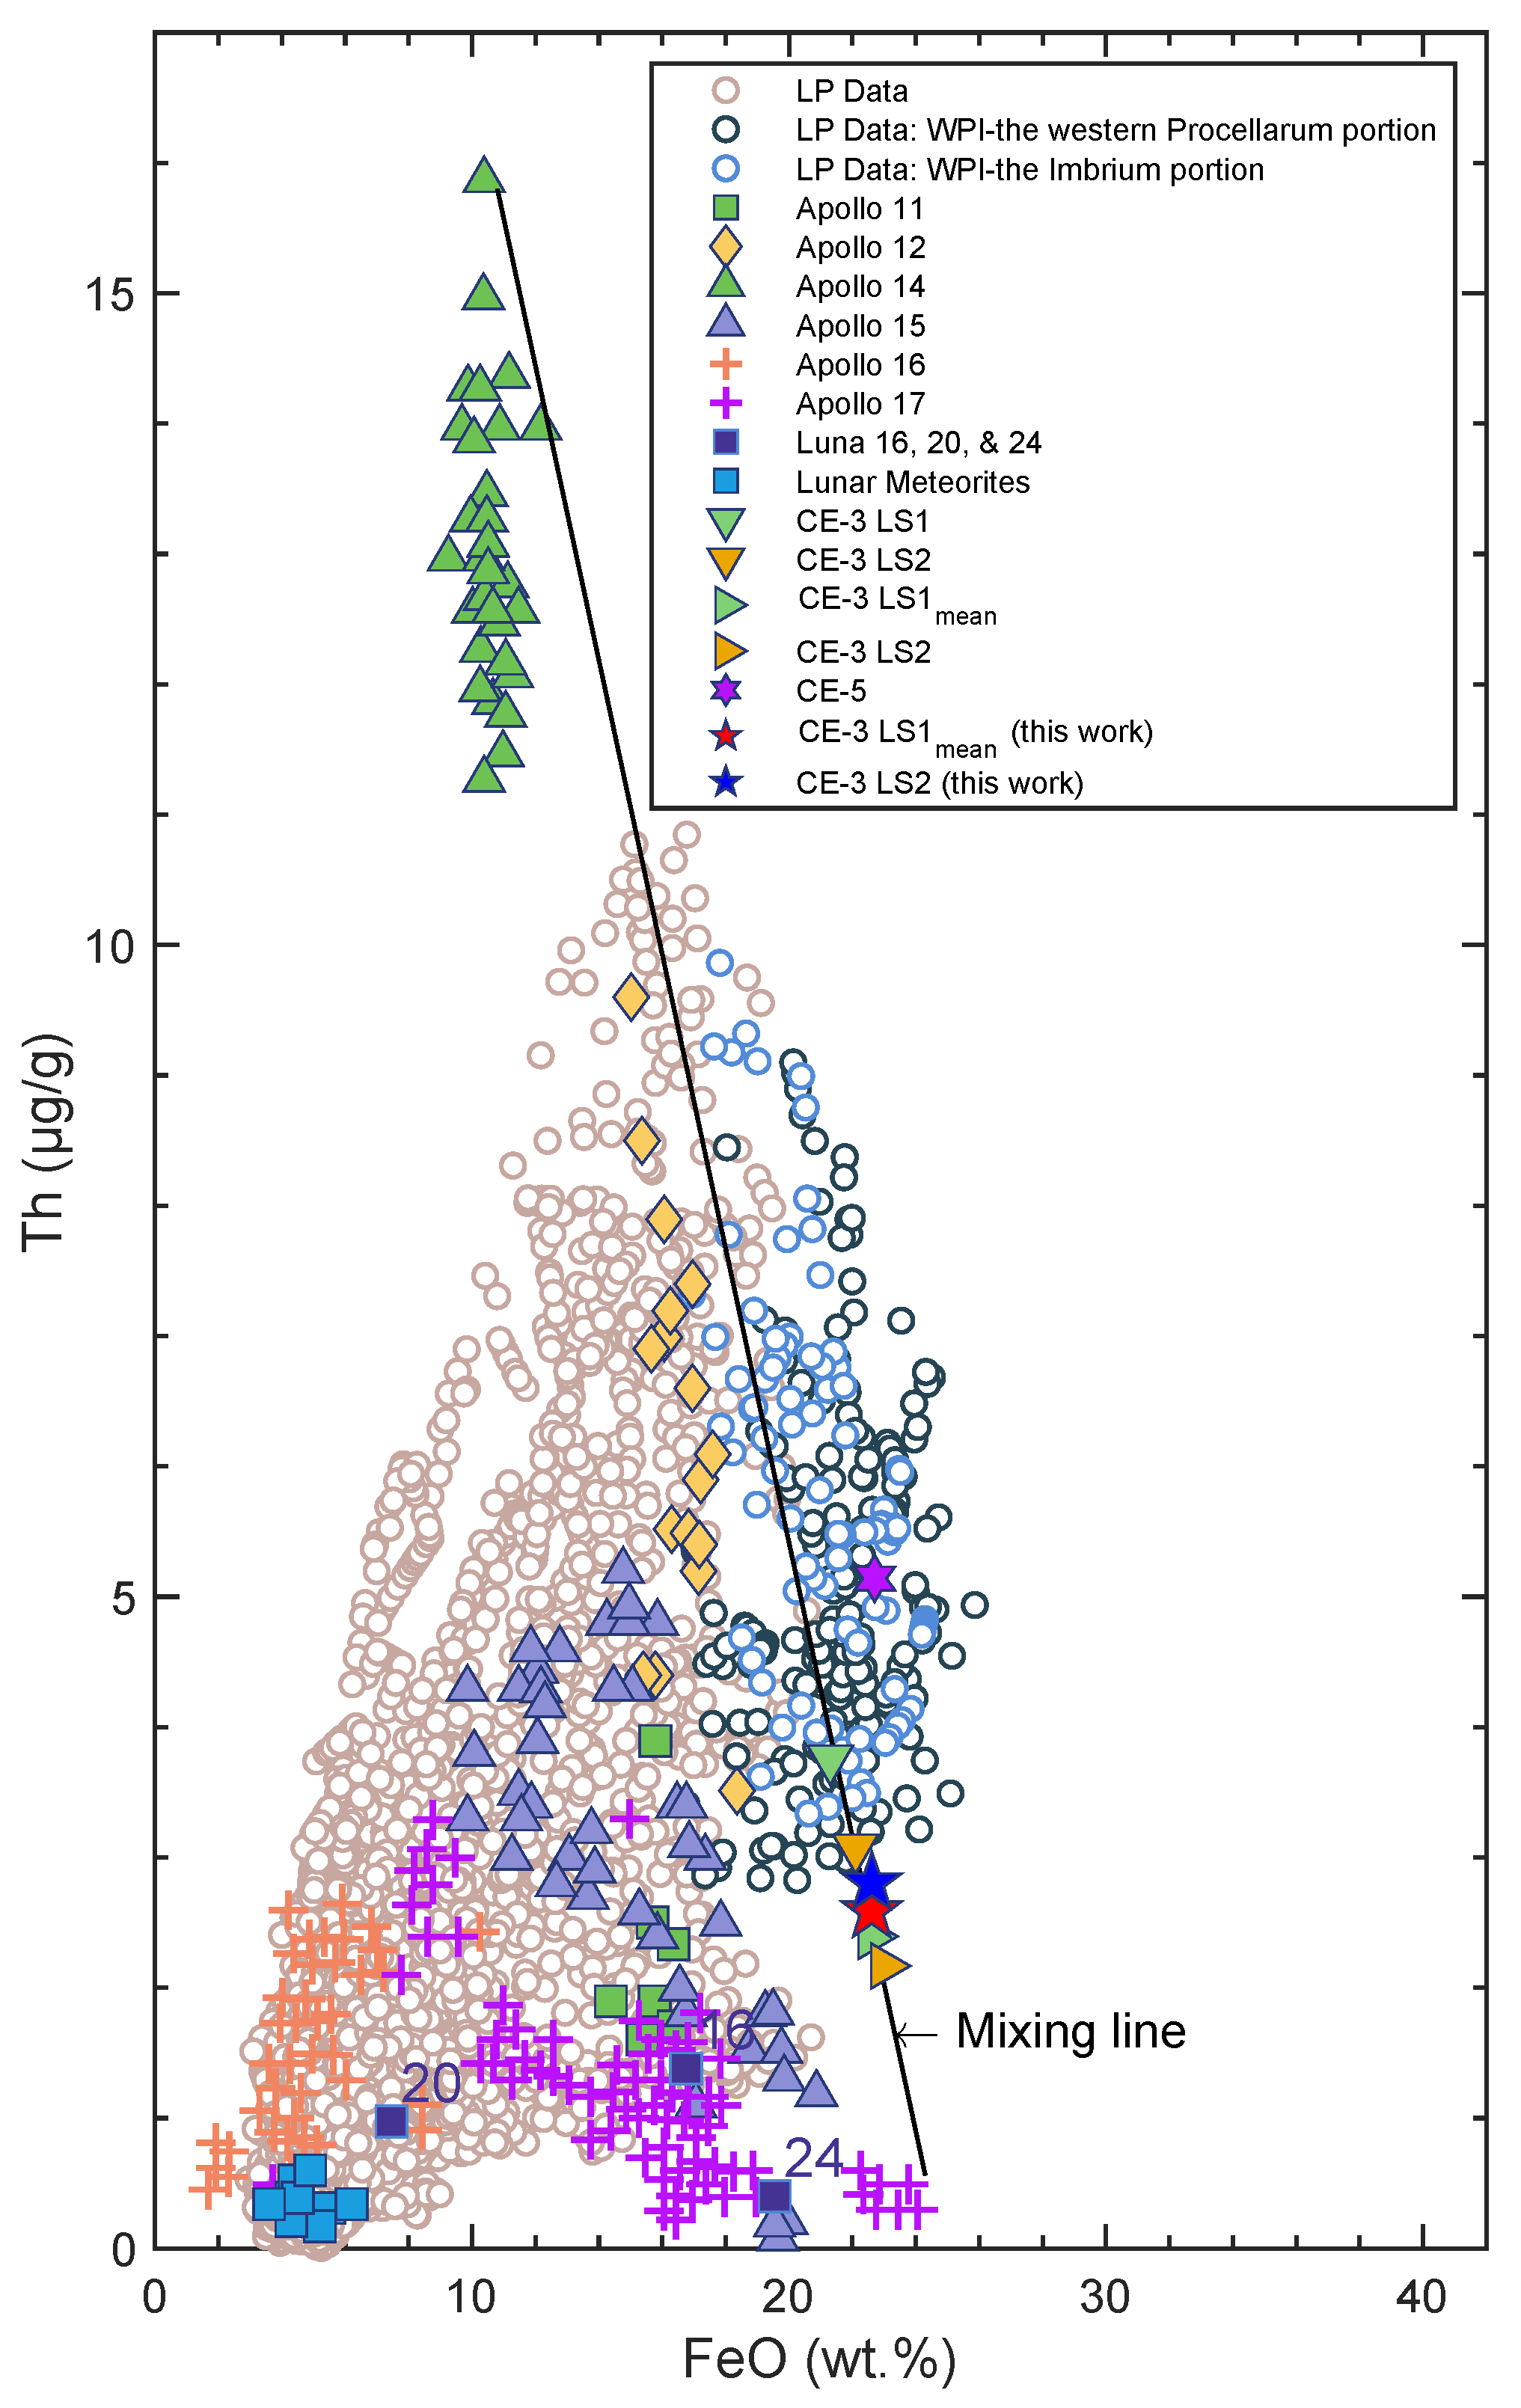
From the KO concentrations, one can obtain the Th concentrations of 2.59–2.80 ppm using the linear relationship of ppm [10]. As shown in Figure 15, one can see from Th-Fe distribution pattern that the trend established by western Procellarum and Imbrium (WPI) of LP-GRS data is close to Apollo 12 data. Also, CE-3 data are more close to the portion of western Procellarum within WPI data, as denoted by black dots. Therefore, FeO, TiO, Th distribution pattern suggests similar geochemical properties of CE-3 landing site and WPI, with a signature of western Procellarum. Moreover, one can see from Figure 14 and Figure 15 that the CE-3 data are close neighbour to the mixing line with non-mare materials, whereas it infers whether the CE-3 landing site to the mixing between low-intermediate Ti mare basalts and non-mare materials needs further study because it is still a controversial question.
The young Eratosthenian (~2.35 Ga [7]) CE-3 basalts are situated in Mare Imbrium, which is a vast lava plain located within the Imbrium Basin. The Imbrium basin, which is the largest impact basin on the nearside of the Moon, was formed on Procellarum KREEP Terrane (PKT, characterized by high Th concentrations of 3–12 ppm at the spatial resolution of orbital mapping, in the Oceanus Procellarum and Mare Imbrium regions) [10,11,56,57,58,59,60,61,62]. The PKT is a terrane enriched in geochemically incompatible elements such as potassium (K), rare earth elements (REE), and phosphorus (P), among other radiogenic heat elements such as uranium (U), and thorium (Th). These elements were concentrated in the last residual liquid of the Lunar Magma Ocean (LMO) as it nearly completed crystallization (i.e., ~99% solidification), and are collectively referred to as “KREEP” [62,63,64,65]. The PKT has also experienced significant volcanic activity, with extensive eruptions of mare basaltic lava occurring over a period spanning from at least 4.2 Ga to ~1 Ga, due to the presence of the radiogenic heat elements that remains this region warm [60,61,62].
Based on our analysis, the young Eratosthenian (~2.35 Ga [7]) CE-3 basalts are a low-intermediate TiO (~3.88 wt.%), high FeO (~22.6 wt.%), low AlO (~10.8 wt.%), intermediate KO (~0.13 wt.%) mare basalt, with a small Mg# of ~0.46. These basalts contain two major mafic minerals of olivine (21–25 wt.%, Table A3) and pyroxene (37–42 wt.%, Table A3), among other minerals such as ilmenite (7–8 wt.%, Table A3) and plagioclase (28–30 wt.%, Table A3). Specifically, we suggest the geochemical properties of these young Erathsthenian CE-3 basalts to a resemblance to the western Procellarum and Imbrium (WPI), with a signature of western Procellarum. Also, the CE-3 soils can be attributive of assimilation of 10–20% of KREEP materials [2]. Therefore, we may infer the possible magma origin of these basalts. The basalts were formed from the late-stage of LMO crystallization, resulting in olivine-bearing, ilmenite-rich cumulate mantles, followed by the late concentration of KREEP minerals, presumably at the base of the ferroan anorthosite crust, as it ascended to the surface.
Furthermore, to date, the youngest (~2.03 Ga [66]) returned lunar soil samples from the CE-5 mission, which is in Oceanus Procellarum at (43.06N, 51.92W), its compositions indicate a high AlO (11.55 wt.%), small Mg# (~0.34), high FeO (22.7 wt.%), intermediate TiO (5.12 wt.%), and high Th (5.14 g/g) content [49]. The CE-5 compositional data are displayed in the above-mentioned correlation plots for comparisons with the CE-3 data. One can see from Figure 12a,b and Figure 14 that CE-3 data sit close to the CE-5 data. But especially, as shown in Th-Fe distribution pattern (Figure 15), the CE-5 data point is slightly distinct from the CE-3 data. The CE-5 soil samples were interpreted as a non-KREEP mantle source but with the KREEP-like signature [49,66], e.g., a small fraction of about 1–1.5% of KREEP-like materials [49]. Thus, the CE-3 and CE-5 basalts are suggested to have probably been formed from different eruption processes, e.g., Refs. [2,49,66]. Also, based on the interpretation of Qian et al., 2023 [67], it appears that there were two distinct sources for the lavas found in the PKT. The first source is responsible for the young basalts, including the CE-5 basalts, which exhibit an increasing abundance of TiO with time. The second source of basalt does not follow this trend, whose differentiation has been noted by Kato et al., 2017 [68]. Overall, it is possible to infer that the CE-3 basalts share a common origin with the first magma source in PKT, but further study is needed.
4. Discussion
(1) As for earlier payloads, such as three generations of Mars rovers on Mars Pathfinder, Mars Exploration Rovers (MER), and Mars Science Laboratory (MSL), all of them utilized the radioactive source of Cm. Among them, the MSL APXS is the optimized version that enables to resolve the peak energies of element ranging from sodium to bromine and beyond with good sensitivities and energy resolution of 200 [email protected] keV. However, it does not consider the detection for lighter elements (such as C and O) due to their large attenuation related to the thickness of both detector window and the atmosphere of Mars [28,69]. The CE-3 APXS, on the other hand, used combination (Fe + Cd) sources instead, this is the first time use in lunar APXS experiment. It provides better energy resolution of 135–142 [email protected] keV than the MSL APXS and allows the detection for the major elements (Mg, Al, Si, K, Ca, Ti, Fe, whose elemental concentration is ≥0.1 wt.%) and trace elements (Ni, Sr, Y, Zr) [25]. It may be noted that only X-ray sources as excitation radiation were deployed in the measurement, so the sensitivity for low-Z elements had to be low, the oxygen (O) and sodium (Na) cannot be measured directly; however, the lunar soil contains only a very small amount of sodium (Na), and thus its effect can be omitted. Also, the valence of iron oxides on the Moon is only Fe due to the redox reaction of solar wind protons, and thus the ratios of oxygen atom to those major elements are determined. Hence, the chemical compositions can be determined. Also, because of the Fe scatters, the concentration of Mn is contaminated, unfortunately. Overall, CE-3 APXS is a reliable instrument that could be widely used for in-situ detection with a much higher spatial resolution than all the other APXS used in lunar explorations.
(2) With regard to some studies based on remote sensing data, as mentioned in Thiessen et al., 2014 [6], some spectral features could not be identified due to the ejecta contamination, causing spectral mixing, such as the CE-3 landing site, which sits close to the boundary of two different geologic units. As we determine the TiO concentration of CE-3 soil samples and regard it as low-intermediate Ti mare basalt, the ground truth provides mineralogical information for the relatively young volcanism and a reference point (as shown in Figure 14 and Figure 15) as calibration information for the estimation by spectral data, for example, the Moon Mineralogy Mapper and the Clementine UV-VIS for mineral mapping, in the future remote sensing studies. Besides, encountering such situation can conduct an in-situ measurement to address this unavoidable limitation of the spectrometer, it is important in order to extend our understanding of the lunar magma evolution.
(3) In the particle size effect correction by numerical calculation applied in lunar X-ray fluorescence, the particle diameter D is assumed to be 45 m (LS1_1 and LS1_2) and 33 m (LS2) for the CE-3 soils in the analysis. Concerning the change in elemental concentrations, we also employ different particle sizes of a coarser and a finer surface, 70 m (an average value for the particle of lunar soil given by Apollo samples [70]) and 10 m (a surface finer than that of the CE-3), respectively, to compare with the assumed particle sizes. The corresponding results of elemental analysis can be found in Table A1 and Table A2. The concentrations of low Z elements Mg, Al, Si exhibit a slight variation of less than about ±0.5% in percent change. For elements ranging from K to Fe, the percent change in concentrations is approximately ±3–5%, where the sign denotes as positive for coarser particles and negative for finer particles, but the element Fe vice versa. The small percent change indicates that the value of particle size is not sensitive to the correction for particle size effect. Also, the variation trend of the amount of the percent change correlates systematically with the absorption K edge energy of each element.
In the model (Figure 9), one can see that the contribution of primary X-ray fluorescence is the integration of the product of with respect to the penetration depth of fluorescent X-rays. This shows that the penetration depth of fluorescent X-rays for each element in the analytic sample is the dominant factor for the particle size effect correction. In particular, the corrections for the concentrations of Ti and Fe are significant due to their transmission depths of X-ray fluorescence, which differ to some extent from those of other elements.
In the case of complex samples, such as pristine soil [54,71], the current model can be enhanced in several aspects.
- While the current model can simulate a specific particle size, it could be enhanced by taking into account the varying porosity, which depends on the size, shape, and arrangement of particles within the sample. However, it should be noted that the particle size distribution of the remaining dust on the surface that has undergone erosion is currently not possible to extract (see Section 2.3.3) with regard to remote measurement. As discussed previously, since different particle sizes are not very sensitive to the particle size effect correction, the current model remains reliable in this case.
- The average atomic mass of lunar soil is an important factor to consider when correcting for particle size effect because different elements in the soil have different mass attenuation coefficients . The mass attenuation coefficient is a measure of how easily X-rays are absorbed by a material, and it relates to the transmission depth of X-ray fluorescence. Thus, the current model is a equivalent model in this case.
(4) As for the implications in future on-site sampling and analysis missions, such as the Viper rover [72] and the PROSPECT driller [73], our study suggests that particle size is an important factor to consider. Specifically, the samples obtained by drilling may contain particles of various sizes, ranging from fine to coarse. This highlights the need to accurately determine and account for particle size in the analysis, in order to reduce the potential uncertainties. Furthermore, to prevent the presence of large particles from interfering with the analysis, it is recommended to use a sieve or similar device to filter them out from the drilling sample beforehand. On the other hand, the uncertainties can be reduced by deploying an in-situ calibration target, which can provide the calibration with the same environmental conditions and working status of the instrument on the Moon, thus enhancing the accuracy of chemical compositional measurement.
5. Conclusions
In this paper, we present an analysis for the derivation of major elements concentrations of the three lunar soil samples in the Chang’E-3 landing site of northern Mare Imbrium, which is the relatively young lunar sample available for in-situ detection, based on the data successfully measured by the Active Particle-induced X-ray Spectrometer onboard the Yutu rover.
We discussed the differences between the results of the previous studies, such as Zhang et al., 2015 [2], Ling et al., 2015 [3] and Wang and Wang, 2015 [13]. The peak fit routine provides a high accuracy determination for complex peak shape rather than previous studies. In this analysis, an optimized model is employed to derive the major elements concentrations directly with the advantages of reliability and being independent of calibration by ground standards. Also, the particle size effect correction is applied in lunar X-ray fluorescence modeling for the elemental analysis, improving the accuracy in determining the elemental concentrations for the actual measurement.
We find that CE-3 APXS data show a low AlO, small Mg#, high FeO, low-intermediate TiO, and intermediate KO content, which manifest a highly evolved magma source with unusual petrological characteristics compared with not only previous lunar regolith samples from Apollo and Luna missions, but also the latest returned lunar soil samples from Chang’E-5 mission. While comparing with remote sensing data, the distribution pattern of FeO, TiO, Th suggests similar geochemical properties of the CE-3 landing site and WPI, with a signature of western Procellarum, and infers whether the CE-3 landing site to the mixing between low-intermediate Ti mare basalts and non-mare materials needs further study.
We infer that the possible magma origin of the young Eratosthenian CE-3 basalts is from the late-stage of LMO crystallization, resulting in olivine-bearing, ilmenite-rich cumulate mantles. This was followed by the late concentration of KREEP minerals, presumably at the base of the ferroan anorthosite crust, as it ascended to the surface. While it is possible that the magma origin of the CE-3 basalts shares a common origin with the magma source, including the CE-5 basalts, in PKT, further study is needed.
Supplementary Materials
The following supporting information can be downloaded at: https://www.mdpi.com/article/10.3390/rs15061643/s1, Table S1: IDs of CE-3 APXS data.
Author Contributions
Conceptualization, M.-H.N. and X.Z.; methodology, M.-H.N. and X.Z.; validation, M.-H.N. and X.Z.; formal analysis, M.-H.N. and X.Z.; data curation, M.-H.N.; writing—original draft preparation, M.-H.N.; writing—review and editing, X.Z., M.-H.N. and Y.X.; visualization, M.-H.N.; supervision, X.Z.; funding acquisition, X.Z. and L.L. All authors have read and agreed to the published version of the manuscript.
Funding
This research was funded by the National Natural Science Foundation of China (grant No. 11761161001) and the Science and Technology Development Fund (FDCT) of Macau (grant Nos. 008/2017/AFJ, 0042/2018/A2, 0014/2022/A1, SKL-LPS(MUST)-2021-2023). This work was also supported by the Space Optoelectronic Measurement & Perception Laboratory of BICE (grant No. LabSOMP-2021-04).
Data Availability Statement
CE-3 APXS data are available at the National Space Science Data Center of China’s National Science and Technology Infrastructure (https://www.nssdc.ac.cn, accessed on 3 August 2021).
Acknowledgments
Scientific data of Chang’E-3 mission are provided by the China National Space Administration (CNSA). We are grateful for the support from the team members of the Ground Research and Application System (GRAS), who contributed to data receiving and preprocessing.
Conflicts of Interest
The authors declare no conflict of interest.
Appendix A
Table A1.
Chemical compositions with their 1 statistical errors in wt.%, normalized to 99% on account of missing elements, such as Mn, Ni, Cr, P, and Na. The particle size is assumed to be 70 m.
Table A1.
Chemical compositions with their 1 statistical errors in wt.%, normalized to 99% on account of missing elements, such as Mn, Ni, Cr, P, and Na. The particle size is assumed to be 70 m.
| Components | LS1_1 (%) | ± | LS1_2 (%) | ± | LS1 (%) | ± | LS2 (%) | ± |
|---|---|---|---|---|---|---|---|---|
| MgO | 9.6 | 1.3 | 11.9 | 1.3 | 10.7 | 1.3 | 10.2 | 1.7 |
| AlO | 11.0 | 1.0 | 11.2 | 1.0 | 11.1 | 1.0 | 10.4 | 1.0 |
| SiO | 41.2 | 0.5 | 40.6 | 0.4 | 40.9 | 0.5 | 41.5 | 0.9 |
| KO | 0.14 | 0.01 | 0.13 | 0.01 | 0.13 | 0.01 | 0.14 | 0.01 |
| CaO | 10.2 | 0.4 | 9.9 | 0.4 | 10.1 | 0.4 | 10.8 | 0.4 |
| TiO | 4.00 | 0.03 | 3.83 | 0.02 | 3.92 | 0.02 | 4.29 | 0.03 |
| FeO | 22.9 | 0.9 | 21.5 | 0.8 | 22.2 | 0.9 | 21.8 | 0.9 |
Table A2.
Chemical compositions with their 1 statistical errors in wt.%, normalized to 99% on account of missing elements, such as Mn, Ni, Cr, P, and Na. The particle size is assumed to be 10 m.
Table A2.
Chemical compositions with their 1 statistical errors in wt.%, normalized to 99% on account of missing elements, such as Mn, Ni, Cr, P, and Na. The particle size is assumed to be 10 m.
| Components | LS1_1 (%) | ± | LS1_2 (%) | ± | LS1 (%) | ± | LS2 (%) | ± |
|---|---|---|---|---|---|---|---|---|
| MgO | 9.6 | 1.3 | 12.0 | 1.4 | 10.8 | 1.3 | 10.2 | 1.7 |
| AlO | 11.0 | 1.0 | 11.2 | 1.0 | 11.1 | 1.0 | 10.4 | 1.0 |
| SiO | 40.9 | 0.5 | 40.2 | 0.4 | 40.5 | 0.5 | 41.2 | 0.9 |
| KO | 0.13 | 0.01 | 0.12 | 0.01 | 0.12 | 0.01 | 0.13 | 0.01 |
| CaO | 9.4 | 0.3 | 9.2 | 0.3 | 9.3 | 0.3 | 10.0 | 0.4 |
| TiO | 3.66 | 0.02 | 3.52 | 0.02 | 3.59 | 0.02 | 3.93 | 0.02 |
| FeO | 24.3 | 1.0 | 22.9 | 0.9 | 23.6 | 0.9 | 23.2 | 1.0 |
Appendix B
Based on the chemical compositions in Table 9, the concentrations of normative minerals of CE-3 soils in wt.% and vol.% are determined using a CIPW (Cross, Iddings, Pirsson and Washington) normative mineralogy calculation [74], where the Fe/(Total Iron) are assumed to be 0.0 on the Moon, as shown in Table A3. For simplicity, we refer to pyroxene as the sum of diopside and hypersthene in Table A3, where diopside represents the high-Ca pyroxene component. Note that CIPW calculation is primarily used on Earth. If used on the Moon, it is an approximate method that reflects the composition of different minerals found on the Moon.
Table A3.
CIPW norms for elemental analysis of CE-3 soil samples in wt.% and vol.%.
| Mixing Components | LS1_1 | LS1_2 | LS1 | LS2 |
|---|---|---|---|---|
| Plagioclase (wt.%) | 29.9 | 30.4 | 30.2 | 28.1 |
| Orthoclase (wt.%) | 0.8 | 0.7 | 0.8 | 0.8 |
| Diopside (wt.%) | 16.6 | 14.9 | 15.7 | 19.6 |
| Hypersthene (wt.%) | 23.9 | 18.0 | 20.9 | 22.4 |
| ∑Pyroxene (wt.%) | 40.6 | 32.9 | 36.7 | 42.0 |
| Olivine (wt.%) | 21.3 | 28.8 | 25.1 | 21.3 |
| Ilmenite (wt.%) | 7.4 | 7.1 | 7.3 | 7.8 |
| ∑ (wt.%) | 100.0 | 100.0 | 100.0 | 100.0 |
| Plagioclase (vol.%) | 36.4 | 36.8 | 36.6 | 34.3 |
| Orthoclase (vol.%) | 1.0 | 1.0 | 1.0 | 1.1 |
| Diopside (vol.%) | 16.4 | 14.7 | 15.6 | 19.5 |
| Hypersthene (vol.%) | 22.3 | 16.9 | 19.6 | 20.9 |
| ∑Pyroxene (vol.%) | 38.7 | 31.6 | 35.1 | 40.4 |
| Olivine (vol.%) | 18.6 | 25.6 | 22.1 | 18.7 |
| Ilmenite (vol.%) | 5.2 | 5.0 | 5.1 | 5.5 |
| ∑ (vol.%) | 100.0 | 100.0 | 100.0 | 100.0 |
References
- Xiao, L. China’s Touch on the Moon. Nat. Geosci. 2014, 7, 391–392. [Google Scholar] [CrossRef]
- Zhang, J.; Yang, W.; Hu, S.; Lin, Y.; Fang, G.; Li, C.; Peng, W.; Zhu, S.; He, Z.; Zhou, B.; et al. Volcanic History of the Imbrium Basin: A Close-up View from the Lunar Rover Yutu. Proc. Natl. Acad. Sci. USA 2015, 112, 5342–5347. [Google Scholar] [CrossRef] [PubMed] [Green Version]
- Ling, Z.; Jolliff, B.L.; Wang, A.; Li, C.; Liu, J.; Zhang, J.; Li, B.; Sun, L.; Chen, J.; Xiao, L.; et al. Correlated Compositional and Mineralogical Investigations at the Chang’e-3 Landing Site. Nat. Commun. 2015, 6, 8880. [Google Scholar] [CrossRef] [PubMed] [Green Version]
- Hiesinger, H.; Jaumann, R.; Neukum, G.; Head, J.W., III. Ages of Mare Basalts on the Lunar Nearside. J. Geophys. Res. Planets 2000, 105, 29239–29275. [Google Scholar] [CrossRef]
- Zhao, J.; Huang, J.; Qiao, L.; Xiao, Z.; Huang, Q.; Wang, J.; He, Q.; Xiao, L. Geologic Characteristics of the Chang’E-3 Exploration Region. Sci. China Phys. Mech. Astron. 2014, 57, 569–576. [Google Scholar] [CrossRef]
- Thiessen, F.; Besse, S.; Staid, M.I.; Hiesinger, H. Mapping Lunar Mare Basalt Units in Mare Imbrium as Observed with the Moon Mineralogy Mapper (M3). Planet. Space Sci. 2014, 104, 244–252. [Google Scholar] [CrossRef]
- Wu, Y.; Li, L.; Luo, X.; Lu, Y.; Chen, Y.; Pieters, C.M.; Basilevsky, A.T.; Head, J.W. Geology, Tectonism and Composition of the Northwest Imbrium Region. Icarus 2018, 303, 67–90. [Google Scholar] [CrossRef]
- Xiao, L.; Zhu, P.; Fang, G.; Xiao, Z.; Zou, Y.; Zhao, J.; Zhao, N.; Yuan, Y.; Qiao, L.; Zhang, X.; et al. A Young Multilayered Terrane of the Northern Mare Imbrium Revealed by Chang’E-3 Mission. Science 2015, 347, 1226–1229. [Google Scholar] [CrossRef] [PubMed]
- Hiesinger, H.; Head, J.W., III; Wolf, U.; Jaumann, R.; Neukum, G. Ages and Stratigraphy of Lunar Mare Basalts in Mare Frigoris and Other Nearside Maria Based on Crater Size-Frequency Distribution Measurements. J. Geophys. Res. Planets 2010, 115, E03003. [Google Scholar] [CrossRef] [Green Version]
- Prettyman, T.H.; Hagerty, J.J.; Elphic, R.C.; Feldman, W.C.; Lawrence, D.J.; McKinney, G.W.; Vaniman, D.T. Elemental Composition of the Lunar Surface: Analysis of Gamma Ray Spectroscopy Data from Lunar Prospector. J. Geophys. Res. Planets 2006, 111, E12007. [Google Scholar] [CrossRef]
- Lawrence, D.J.; Feldman, W.C.; Barraclough, B.L.; Binder, A.B.; Elphic, R.C.; Maurice, S.; Miller, M.C.; Prettyman, T.H. Thorium Abundances on the Lunar Surface. J. Geophys. Res. Planets 2000, 105, 20307–20331. [Google Scholar] [CrossRef] [Green Version]
- Prettyman, T.H.; Feldman, W.C.; Lawrence, D.J.; McKinney, G.W.; Binder, A.B.; Elphic, R.C.; Gasnault, O.M.; Maurice, S.; Moore, K.R. Library Least Squares Analysis of Lunar Prospector Gamma Ray Spectra. In Proceedings of the 33rd Annual Lunar and Planetary Science Conference, Houston, TX, USA, 11–15 March 2002; p. 2012. [Google Scholar]
- Wang, J.; Wang, X. Estimation of Lunar Major Elemental Abundances in Chang’E-3 Landing Site Based on Active Particle-induced X-ray Spectrometer (APXS). Astrophys. Space Sci. 2015, 359, 8. [Google Scholar] [CrossRef]
- Wu, M. The Study on Data Processing Method of CHANG’E-3 Alpha Particle X-ray Spectrometer. Ph.D. Thesis, University of Chinese Academy of Sciences, Beijing, China, 2012. [Google Scholar]
- Okada, T.; Kuwada, Y. Effect of Surface Roughness on X-ray Fluorescence Emission from Planetary Surfaces. In Proceedings of the 28th Lunar and Planetary Science Conference, Houston, TX, USA, 17–21 March 1997; Volume 28, p. 039. [Google Scholar]
- Näränen, J.; Parviainen, H.; Muinonen, K. X-ray Fluorescence Modelling for Solar System Regoliths: Effects of Viewing Geometry, Particle Size, and Surface Roughness. Proc. Int. Astron. Union 2006, 2, 243–250. [Google Scholar] [CrossRef] [Green Version]
- Maruyama, Y.; Ogawa, K.; Okada, T.; Kato, M. Laboratory Experiments of Particle Size Effect in X-ray Fluorescence and Implications to Remote X-ray Spectrometry of Lunar Regolith Surface. Earth Planets Space 2008, 60, 293–297. [Google Scholar] [CrossRef] [Green Version]
- Bertol, A.; Chaves, P.; Hinrichs, R.; Vasconcellos, M.; Reis, M. Methodology for a Fast Determination of EDX Si(Li) Detector Response Function in the 5 keV to 15 keV Range. Nucl. Instrum. Methods Phys. Res. Sect. A Accel. Spectrometers Detect. Assoc. Equip. 2018, 908, 394–400. [Google Scholar] [CrossRef]
- Pérez, P.D.; Bertol, A.P.L.; Rodríguez, T.P.; Vasconcellos, M.A.Z.; Trincavelli, J.C. Bremsstrahlung in Carbon Thick Targets by Proton Incidence. Nucl. Instrum. Methods Phys. Res. Sect. B Beam Interact. Mater. Atoms 2014, 318, 23–26. [Google Scholar] [CrossRef]
- Alves, L.; Jesus, A.; Reis, M. Experimental X-ray Peak-Shape Determination for a Si(Li) Detector. Nucl. Instrum. Methods Phys. Res. Sect. Beam Interact. Mater. Atoms 1996, 109–110, 129–133. [Google Scholar] [CrossRef]
- Campbell, J.L. Si(Li) Detector Response and PIXE Spectrum Fitting. Nucl. Instrum. Methods Phys. Res. Sect. Beam Interact. Mater. Atoms 1996, 109–110, 71–78. [Google Scholar] [CrossRef]
- Peng, W.; Wang, H.; Cui, X.; Zhang, C.; Liang, X.; Liu, Y.; Cao, X.L.; Zhang, C.; Zhang, J.; Wang, J.; et al. Active Particle-Induced X-ray Spectrometer for Chang’e-3 YuTu Rover Mission and Its First Results. In Proceedings of the 45th Lunar and Planetary Science Conference, The Woodlands, TX, USA, 17–21 March 2014. [Google Scholar]
- National Astronomical Observatories, Chinese Academy of Sciences (Lunar & Deep Space Exploration). Report for CE-3 APXS Scientific Verification Experiments (File Number: CE3-GRAS-CSSY-004); Technical Report; National Astronomical Observatories, Chinese Academy of Sciences (Lunar & Deep Space Exploration): Beijing, China, 2013. [Google Scholar]
- National Astronomical Observatories, Chinese Academy of Sciences (Lunar & Deep Space Exploration). Report for CE-3 APXS Scientific Verification Experiments (File Number: CE3-GRAS-CSSY-004-F2); Technical Report; National Astronomical Observatories, Chinese Academy of Sciences (Lunar & Deep Space Exploration): Beijing, China, 2013. [Google Scholar]
- Fu, X.H.; Li, C.L.; Zhang, G.L.; Zou, Y.L.; Liu, J.J.; Ren, X.; Tan, X.; Zhang, X.X.; Zuo, W.; Wen, W.B.; et al. Data Processing for the Active Particle-induced X-ray Spectrometer and Initial Scientific Results from Chang’e-3 Mission. Res. Astron. Astrophys. 2014, 14, 1595–1606. [Google Scholar] [CrossRef]
- Guo, D.Y.; Wang, H.Y.; Peng, W.X.; Cui, X.Z.; Zhang, C.M.; Liu, Y.Q.; Liang, X.H.; Dong, Y.F.; Wang, J.Z.; Gao, M.; et al. Ground-Based Verification and Data Processing of Yutu Rover Active Particle-induced X-ray Spectrometer. Chin. Phys. C 2015, 39, 076002. [Google Scholar] [CrossRef] [Green Version]
- National Astronomical Observatories, Chinese Academy of Sciences (Grand Research and Application System). Chang’E-3 Active Particle Induced X-ray Spectrometer Level 2B Scientific Dataset; V1.0; National Space Science Data Center: Beijing, China, 2015. [Google Scholar] [CrossRef]
- Gellert, R.; Rieder, R.; Brückner, J.; Clark, B.C.; Dreibus, G.; Klingelhöfer, G.; Lugmair, G.; Ming, D.W.; Wänke, H.; Yen, A.; et al. Alpha Particle X-ray Spectrometer (APXS): Results from Gusev Crater and Calibration Report. J. Geophys. Res. Planets 2006, 111, E02S05. [Google Scholar] [CrossRef]
- Phillips, G.W.; Marlow, K.W. Automatic Analysis of Gamma-Ray Spectra from Germanium Detectors. Nucl. Instrum. Methods 1976, 137, 525–536. [Google Scholar] [CrossRef]
- Di Marco, V.B.; Bombi, G. Mathematical Functions for the Representation of Chromatographic Peaks. J. Chromatogr. A 2001, 931, 1–30. [Google Scholar] [CrossRef] [PubMed]
- Brun, R.; Rademakers, F.; Canal, P.; Naumann, A.; Couet, O.; Moneta, L.; Vassilev, V.; Linev, S.; Piparo, D.; GANIS, G.; et al. Root-Project/Root: V6.18/02. Zenodo 2019. [Google Scholar] [CrossRef]
- Beckhoff, B. (Ed.) Handbook of Practical X-ray Fluorescence Analysis; Springer: Berlin, Germany; New York, NY, USA, 2006. [Google Scholar]
- Rousseau, R. Corrections for Matrix Effects in X-ray Fluorescence Analysis—A Tutorial. Spectrochim. Acta Part B At. Spectrosc. 2006, 61, 759–777. [Google Scholar] [CrossRef]
- Poehn, C.; Wernisch, J.; Hanke, W. Least-Squares Fits of Fundamental Parameters for Quantitative X-ray Analysis as a Function of Z (11 ≤ Z ≤ 83) and E (1 keV ≤ E ≤ 50 keV). X-ray Spectrom. 1985, 14, 120–124. [Google Scholar] [CrossRef]
- Berger, M.; Hubbell, J.; Seltzer, S.; Chang, J.; Coursey, J.; Sukumar, R.; Zucker, D.; Olsen, K. XCOM: Photon Cross Section Database (Version 1.5). 2010. Available online: http://physics.nist.gov/xcom (accessed on 13 September 2022).
- Daoudi, S.; Kahoul, A.; Sahnoune, Y.; Bahri, D.; Kasri, Y.; Khalfallah, F.; Aylikci, V.; Kup Aylikci, N.; Medjadi, D.; Nekkab, M. New K-shell Fluorescence Yields Curve for Elements with 3≤Z≤99. J. Korean Phys. Soc. 2015, 67, 1537–1543. [Google Scholar] [CrossRef]
- Scofield, J.H. Relativistic Hartree-Slater Values for K and L X-ray Emission Rates. At. Data Nucl. Data Tables 1974, 14, 121–137. [Google Scholar] [CrossRef]
- Deslattes, R.D.; Kessler, E.G., Jr.; Indelicato, P.; de Billy, L.; Lindroth, E.; Anton, J.; Coursey, J.S.; Schwab, D.J.; Chang, C.; Sukumar, R.; et al. X-ray Transition Energies (Version 1.2). 2005. Available online: http://physics.nist.gov/XrayTrans (accessed on 5 September 2022).
- Xu, T.Y.; Hapke, B.; Zhang, X.P.; Wu, Y.Z.; Lu, X.P. Spectrophotometry of the Lunar Regolith Using the Chang’E-3 Panoramic Camera (PCAM). Astron. Astrophys. 2022, 665, A15. [Google Scholar] [CrossRef]
- Jin, W.; Zhang, H.; Yuan, Y.; Yang, Y.; Shkuratov, Y.G.; Lucey, P.G.; Kaydash, V.G.; Zhu, M.H.; Xue, B.; Di, K.; et al. In Situ Optical Measurements of Chang’E-3 Landing Site in Mare Imbrium: 2. Photometric Properties of the Regolith. Geophys. Res. Lett. 2015, 42, 8312–8319. [Google Scholar] [CrossRef] [Green Version]
- You, J.; Zhang, X.; Zhang, H.; Li, C.; Xu, Y.; Yan, Q.; Yu, H.; Liu, J.; Li, Y.; Wang, Y.; et al. Analysis of Plume–Lunar Surface Interaction and Soil Erosion during the Chang’E-4 Landing Process. Acta Astronaut. 2021, 185, 337–351. [Google Scholar] [CrossRef]
- Wang, Z.; Wu, Y.; Blewett, D.T.; Cloutis, E.A.; Zheng, Y.; Chen, J. Submicroscopic Metallic Iron in Lunar Soils Estimated from the in Situ Spectra of the Chang’E-3 Mission. Geophys. Res. Lett. 2017, 44, 3485–3492. [Google Scholar] [CrossRef]
- Clegg-Watkins, R.N.; Jolliff, B.L.; Boyd, A.; Robinson, M.S.; Wagner, R.; Stopar, J.D.; Plescia, J.B.; Speyerer, E.J. Photometric Characterization of the Chang’e-3 Landing Site Using LROC NAC Images. Icarus 2016, 273, 84–95. [Google Scholar] [CrossRef]
- Kiefer, W.S.; Macke, R.J.; Britt, D.T.; Irving, A.J.; Consolmagno, G.J. The Density and Porosity of Lunar Rocks. Geophys. Res. Lett. 2012, 39, L07201. [Google Scholar] [CrossRef] [Green Version]
- Cookson, J.A.; Campbell, J.L. Specimen Surface Effects in Thick-Target PIXE Analysis. Nucl. Instrum. Methods Phys. Res. 1983, 216, 489–495. [Google Scholar] [CrossRef]
- Rousseau, R. How to Apply the Fundamental Parameters Method to the Quantitative X-ray Fluorescence Analysis of Geological Materials. J. Geosci. Geomat. 2013, 1, 1–7. [Google Scholar] [CrossRef]
- Haskin, L.; Warren, P. Chapter 8—Lunar Chemistry. In Lunar Sourcebook: A User’s Guide to the Moon; Heiken, G.H., Vaniman, D.T., French, B.M., Eds.; Cambridge University Press: New York, NY, USA, 1991. [Google Scholar]
- Korotev, R.L.; Jolliff, B.L.; Zeigler, R.A.; Gillis, J.J.; Haskin, L.A. Feldspathic Lunar Meteorites and Their Implications for Compositional Remote Sensing of the Lunar Surface and the Composition of the Lunar Crust. Geochim. Cosmochim. Acta 2003, 67, 4895–4923. [Google Scholar] [CrossRef]
- Zong, K.; Wang, Z.; Li, J.; He, Q.; Li, Y.; Becker, H.; Zhang, W.; Hu, Z.; He, T.; Cao, K.; et al. Bulk Compositions of the Chang’E-5 Lunar Soil: Insights into Chemical Homogeneity, Exotic Addition, and Origin of Landing Site Basalts. Geochim. Cosmochim. Acta 2022, 335, 284–296. [Google Scholar] [CrossRef]
- Lai, J.; Xu, Y.; Zhang, X.; Tang, Z. Structural Analysis of Lunar Subsurface with Chang’E-3 Lunar Penetrating Radar. Planet. Space Sci. 2016, 120, 96–102. [Google Scholar] [CrossRef]
- O’Hara, M.J. Feldspathic Mare Basalts at the Apollo 17 Landing Site, Taurus–Littrow. J. Petrol. 2001, 42, 1401–1427. [Google Scholar] [CrossRef]
- Heiken, G.H.; McKay, D.S.; Brown, R.W. Lunar Deposits of Possible Pyroclastic Origin. Geochim. Cosmochim. Acta 1974, 38, 1703–1718. [Google Scholar] [CrossRef]
- Meyer, C., Jr.; McKay, D.S.; Anderson, D.H.; Butler, P., Jr. The Source of Sublimates on the Apollo 15 Green and Apollo 17 Orange Glass Samples. Lunar Planet. Sci. Conf. Proc. 1975, 2, 1673–1699. [Google Scholar]
- Delano, J.W. Pristine Lunar Glasses: Criteria, Data, and Implications. Lunar Planet. Sci. Conf. Proc. 1986, 91, 201–213. [Google Scholar] [CrossRef]
- Hui, H.; Hess, K.U.; Zhang, Y.; Nichols, A.R.L.; Peslier, A.H.; Lange, R.A.; Dingwell, D.B.; Neal, C.R. Cooling Rates of Lunar Orange Glass Beads. Earth Planet. Sci. Lett. 2018, 503, 88–94. [Google Scholar] [CrossRef]
- Haskin, L.A.; Gillis, J.J.; Korotev, R.L.; Jolliff, B.L. The Materials of the Lunar Procellarum KREEP Terrane: A Synthesis of Data from Geomorphological Mapping, Remote Sensing, and Sample Analyses. J. Geophys. Res. Planets 2000, 105, 20403–20415. [Google Scholar] [CrossRef] [Green Version]
- Jolliff, B.L.; Gillis, J.J.; Haskin, L.A.; Korotev, R.L.; Wieczorek, M.A. Major Lunar Crustal Terranes: Surface Expressions and Crust-Mantle Origins. J. Geophys. Res. Planets 2000, 105, 4197–4216. [Google Scholar] [CrossRef] [Green Version]
- Lawrence, D.J.; Feldman, W.C.; Barraclough, B.L.; Binder, A.B.; Elphic, R.C.; Maurice, S.; Thomsen, D.R. Global Elemental Maps of the Moon: The Lunar Prospector Gamma-Ray Spectrometer. Science 1998, 281, 1484. [Google Scholar] [CrossRef] [Green Version]
- Lawrence, D.J.; Feldman, W.C.; Barraclough, B.L.; Binder, A.B.; Elphic, R.C.; Maurice, S.; Miller, M.C.; Prettyman, T.H. High Resolution Measurements of Absolute Thorium Abundances on the Lunar Surface. Geophys. Res. Lett. 1999, 26, 2681–2684. [Google Scholar] [CrossRef] [Green Version]
- Spohn, T.; Breuer, D.; Johnson, T.V. (Eds.) Encyclopedia of the Solar System, 3rd ed.; Elsevier: Boston, MA, USA, 2014. [Google Scholar] [CrossRef]
- Hiesinger, H.; Jaumann, R. Chapter 23—The Moon. In Encyclopedia of the Solar System, 3rd ed.; Spohn, T., Breuer, D., Johnson, T.V., Eds.; Elsevier: Boston, MA, USA, 2014; pp. 493–538. [Google Scholar] [CrossRef]
- Elardo, S. Lunar Magma Ocean Theory, Origins, and Rationale. In Encyclopedia of Lunar Science; Cudnik, B., Ed.; Springer International Publishing: Cham, Switzerland, 2016; pp. 1–8. [Google Scholar] [CrossRef]
- Warren, P.H.; Wasson, J.T. The Origin of KREEP. Rev. Geophys. 1979, 17, 73–88. [Google Scholar] [CrossRef]
- Heiken, G.H.; Vaniman, D.T.; French, B.M. (Eds.) Lunar Sourcebook: A User’s Guide to the Moon; Cambridge University Press: New York, NY, USA, 1991. [Google Scholar]
- Vaniman, D.; Dietrich, J.; Taylor, G.J.; Heiken, G. Chapter 2—Exploration, Samples, and Recent Concepts of the Moon. In Lunar Sourcebook: A User’s Guide to the Moon; Heiken, G.H., Vaniman, D.T., French, B.M., Eds.; Cambridge University Press: New York, NY, USA, 1991. [Google Scholar]
- Tian, H.C.; Wang, H.; Chen, Y.; Yang, W.; Zhou, Q.; Zhang, C.; Lin, H.L.; Huang, C.; Wu, S.T.; Jia, L.H.; et al. Non-KREEP Origin for Chang’e-5 Basalts in the Procellarum KREEP Terrane. Nature 2021, 600, 59–63. [Google Scholar] [CrossRef] [PubMed]
- Qian, Y.; She, Z.; He, Q.; Xiao, L.; Wang, Z.; Head, J.W.; Sun, L.; Wang, Y.; Wu, B.; Wu, X.; et al. Mineralogy and Chronology of the Young Mare Volcanism in the Procellarum-KREEP-Terrane. Nat. Astron. 2023, 1–11. [Google Scholar] [CrossRef]
- Kato, S.; Morota, T.; Yamaguchi, Y.; Watanabe, S.i.; Otake, H.; Ohtake, M. Magma Source Transition of Lunar Mare Volcanism at 2.3 Ga. Meteorit. Planet. Sci. 2017, 52, 1899–1915. [Google Scholar] [CrossRef]
- Campbell, J.L.; Lee, M.; Jones, B.N.; Andrushenko, S.M.; Holmes, N.G.; Maxwell, J.A.; Taylor, S.M. A Fundamental Parameters Approach to Calibration of the Mars Exploration Rover Alpha Particle X-ray Spectrometer. J. Geophys. Res. Planets 2009, 114, E04006. [Google Scholar] [CrossRef] [Green Version]
- Carrier, W.D.I.; Olhoeft, G.R.; Mendell, W. Chapter 9—Physical Properties of the Lunar Surface. In Lunar Sourcebook: A User’s Guide to the Moon; Heiken, G.H., Vaniman, D.T., French, B.M., Eds.; Cambridge University Press: New York, NY, USA, 1991; pp. 475–594. [Google Scholar]
- McKay, D.S.; Heiken, G.; Basu, A.; Blanford, G.; Simon, S.; Reedy, R.; French, B.M.; Papike, J. Chapter 7—The Lunar Regolith. In Lunar Sourcebook: A User’s Guide to the Moon; Heiken, G.H., Vaniman, D.T., French, B.M., Eds.; Cambridge University Press: New York, NY, USA, 1991. [Google Scholar]
- Colaprete, A.; Elphic, R.C.; Shirley, M.; Ennico-Smith, K.; Lim, D.S.S.; Zacny, K.; Captain, J.; Seigler, M.; Balaban, E.; Beyer, R.; et al. Key Science Questions to Be Addressed by the Volatiles Investigating Polar Exploration Rover (VIPER). LPI Contrib. 2022, 2703, 5011. [Google Scholar]
- Boazman, S.; Kereszturi, A.; Heather, D.; Sefton-Nash, E.; Orgel, C.; Tomka, R.; Houdou, B.; Lefort, X. Analysis of the Lunar South Polar Region for PROSPECT, NASA/CLPS. In Proceedings of the Europlanet Science Congress 2022, Palacio de Congresos de Granada, Spain, 18–23 September 2022; p. EPSC2022-530. [Google Scholar] [CrossRef]
- Hollocher, K. NORM4 Excel Spreadsheet Programs to Calculate Petrologic Norms from Whole-Rock Chemical Analyses. Zenodo 2022. [Google Scholar] [CrossRef]
Figure 1.
Yutu landed on the eastern rim of the Zi Wei crater. The landing site of Chang’E-3 mission is marked by a white star. The base image is from the Lunar Reconnaissance Orbiter Camera Narrow Angle Camera (LROC NAC; NAC image ID: M181302794L).
Figure 1.
Yutu landed on the eastern rim of the Zi Wei crater. The landing site of Chang’E-3 mission is marked by a white star. The base image is from the Lunar Reconnaissance Orbiter Camera Narrow Angle Camera (LROC NAC; NAC image ID: M181302794L).

Figure 2.
Geometry and working principle of APXS (working distance 10 mm).

Figure 3.
APXS spectrum of calibration target measured on 11 January 2014 (UTC). NiK peak is mainly from materials in collimator and target holder. Cu peaks are mainly from collimator and target frame with copper coating.
Figure 3.
APXS spectrum of calibration target measured on 11 January 2014 (UTC). NiK peak is mainly from materials in collimator and target holder. Cu peaks are mainly from collimator and target frame with copper coating.

Figure 4.
APXS spectra of lunar soil samples (LS1_1 and LS1_2) measured on 24 December 2013 (UTC). NiK peak is partly from materials in the collimator.
Figure 4.
APXS spectra of lunar soil samples (LS1_1 and LS1_2) measured on 24 December 2013 (UTC). NiK peak is partly from materials in the collimator.

Figure 5.
APXS spectrum of lunar soil sample (LS2) measured on 14 January 2014 (UTC). NiK peak is partly from materials in the collimator.
Figure 5.
APXS spectrum of lunar soil sample (LS2) measured on 14 January 2014 (UTC). NiK peak is partly from materials in the collimator.

Figure 6.
Spectra fitting of soil samples and calibration target are shown in the upper part of each panel: (a) soil sample LS1_1, (b) soil sample LS1_2, (c) calibration target, (d) soil sample LS2. The horizontal axis is the channel number. The vertical axis is the counts per second. The red line indicates the total fitting. The green lines indicate the signal (detector response) functions. The gray line indicates the background. The corresponding residuals of the fit, defined by the ratio of the difference between the fitting result and measurement data to measurement error, are plotted in the bottom part of each panel.


Figure 7.
Illustration of geometrical decomposition for APXS.

Figure 8.
The X-ray detection efficiency curve of SDD with the incidence angle .

Figure 9.
Flow chart depicting the numerical calculation for the particle size effect in X-ray fluorescence.
Figure 9.
Flow chart depicting the numerical calculation for the particle size effect in X-ray fluorescence.

Figure 10.
Flow chart depicting the Fundamental Parameter Method for determination of elemental concentrations from APXS measurements.
Figure 10.
Flow chart depicting the Fundamental Parameter Method for determination of elemental concentrations from APXS measurements.

Figure 11.
(a) Comparison plot for soil sample LS1. (b) Comparison plot for soil sample LS2. These comparison plots are shown for validation purposes. The horizontal axis represents the chemical compositions of soil samples in wt.% (This study, see Table 9). The vertical axis shows the ratios of our results to those of Refs. [2,3,13]. The green color indicates the comparisons between this study and Ref. [2], the navy blue color indicates comparisons with Ref. [3], and the orange color indicates comparisons with Ref. [13]. For the sake of readability, the denotations marked in navy blue and orange colors are slightly shifted laterally, while the denotations marked in green color remain in the same placement.

Figure 12.
(a) Scatter plot of AlO versus FeO. (b) Scatter plot of AlO versus Mg# (molar ). The elemental abundance data derived from gamma-ray spectrometer (GRS) of Lunar Prospector (LP) are plotted [10,12], which were binned onto a map with 5. The compositional data of sample soil and regolith breccias (<1 cm-diameter) from each Apollo mission is plotted (cf. Haskin and Warren, 1991 [47]). Also, for the Luna missions, a single point for each mission is plotted. “Meteorite” points each represent one of the regolith-breccia lunar meteorites [48]. Red and blue star indicate the concentrations of soil samples LS1 and LS2 of CE-3, respectively (this study). Green and orange down-pointing triangle indicate the concentrations of soil samples LS1 and LS2 of CE-3, respectively [2]. Green and orange right-pointing triangle indicate the concentrations of soil samples LS1 and LS2 of CE-3, respectively [3]. Purple hexagram indicates the concentrations of returned lunar soil sample of CE-5 [49].

Figure 13.
The CE-3 rover captured image of the Loong Rock, which is located ~11 m away from the soil sample LS2, displaying its detailed morphology in subfigure (a) and panoramic view in subfigure (b). These images were obtained by the PCAMs mounted on the mast onboard the Yutu rover at (44.11864N, 19.50996W). The data IDs for the images are provided as follows: CE3_BMYK_PCAML-C-012_SCI_N_20140113191206_20140113191206_0008_A.2C and CE3_BMYK_PCAML-C-013_SCI_N_20140113191309_20140113191309_0008_A.2C.

Figure 14.
Scatter plot (FeO versus TiO). In addition to similar indications to Figure 12, within the western Procellarum and Imbrium (WPI, cf. Prettyman et al., 2006 [10]), the portion of Imbrium and the portion of western Procellarum denote as blue and black dots, respectively. As seen in the plot, the Apollo 17 data deviate from the main trend established by LP-GRS data. This is due to the presence of a unique type of lunar rock known as the “orange soil”, which is believed to be a type of volcanic glass that was formed by gas-charged fire fountain volcanic eruptions [2,3,49,51,52,53,54,55].

Figure 15.
Scatter plot (Th versus FeO). In addition to similar indications to Figure 12, within the western Procellarum and Imbrium (WPI, cf. Prettyman et al., 2006 [10]), the portion of Imbrium and the portion of western Procellarum denote as blue and black dots, respectively [2,3,49].

Table 1.
Comparison of the results of major elements concentrations with their errors in wt.% in CE-3 landing site from previous studies [2,3,13].
| Components | Soil Samples (wt.%) [2,3,13] | Percentage Differences (%) | |||
|---|---|---|---|---|---|
| LS1 [2] | LS1 [3] | LS1 [13] | |||
| MgO | 9.9 (1.5) | 6.7 (0.1) | 6.62 (0.41) | −32.3 (10.3) | −33.1 (10.9) |
| AlO | 11.5 (0.9) | 9.9 (0.7) | 10.08 (0.26) | −13.9 (9.1) | −12.3 (7.2) |
| SiO | 42.8 (/) | 42.0 (3.1) | 41.49 (2.99) | −1.9 (7.2) | −3.1 (7.0) |
| KO | 0.18 (0.01) | 0.12 (0.01) | 0.12 (0.08) | −33.3 (6.68) | −33.3 (44.6) |
| CaO | 10.4 (0.3) | 12.6 (0.4) | 11.97 (0.86) | +21.2 (5.2) | +15.3 (8.9) |
| TiO | 4.0 (0.2) | 5.2 (0.1) | 5.56 (0.38) | +30.3 (7.0) | +39.0 (11.8) |
| FeO | 21.3 (1.7) | 22.6 (2.1) | 23.25 (3.72) | +6.1 (13.0) | +9.2 (19.5) |
| LS2 [2] | LS2 [3] | LS2 [13] | |||
| MgO | 8.9 (1.9) | 11.0 (0.1) | 6.96 (0.07) | +23.6 (26.4) | −21.8 (16.7) |
| AlO | 10.5 (1.0) | 9.3 (0.6) | 10.07 (0.27) | −11.4 (10.2) | −4.1 (9.5) |
| SiO | 43.2 (/) | 39.6 (3.0) | 40.8 (2.3) | −8.3 (6.9) | −5.6 (5.3) |
| KO | 0.15 (0.01) | 0.11 (0.01) | 0.14 (0.06) | −26.7 (8.27) | −6.7 (40.5) |
| CaO | 10.9 (0.4) | 11.2 (0.3) | 11.83 (0.72) | +2.8 (4.7) | +8.5 (7.7) |
| TiO | 4.3 (0.2) | 4.6 (0.1) | 5.57 (0.39) | +7.0 (5.5) | +29.5 (10.9) |
| FeO | 22.1 (1.9) | 23.0 (2.1) | 23.76 (4.23) | +4.1 (13.1) | +7.5 (21.3) |
Table 2.
Listed are the energy and relative intensity of characteristic X-rays emitting from radioactive sources (Fe + Cd) used in APXS for the analysis [24].
Table 2.
Listed are the energy and relative intensity of characteristic X-rays emitting from radioactive sources (Fe + Cd) used in APXS for the analysis [24].
| Line | Energy (keV) | Relative Intensity (%) |
|---|---|---|
| Fe (half-life: 2.744 years) | ||
| Mn K | 5.890 | 24.4 |
| Mn K | 6.49 | 2.85 |
| Cd (half-life: 1.264 years) | ||
| XR K | 21.99 | 29.7 |
| XR K | 22.163 | 56.0 |
| XR K | 24.912 | 4.79 |
| XR K | 24.943 | 9.2 |
| XR K | 25.455 | 2.31 |
| 88 | 3.7 | |
Table 3.
The elemental concentrations in wt.% of calibration target for APXS in-situ calibration [22,25].
| Element | Concentration (%) |
|---|---|
| Na | 3.12 |
| Mg | 6.07 |
| Al | 7.13 |
| Si | 21.56 |
| P | 0.222 |
| S | 0.26 |
| K | 1.42 |
| Ca | 5.11 |
| Ti | 1.23 |
| Cr | 0.049 |
| Mn | 0.111 |
| Fe | 7.77 |
| Ni | 0.034 |
Table 4.
Summary of the measurements with the identifier, location and time in this study.
| Measurement | Identifier | Location | Time (UTC) |
|---|---|---|---|
| 2BCE3-0006 | LS1_1, LS1_2 | (44.11869 N, 19.50886W) | 24 December 2013 |
| 2BCE3-0007 | calibration target | (44.11861N, 19.50919W) | 11 January 2014 |
| 2BCE3-0008 | LS2 | (44.11864N, 19.50996W) | 14 January 2014 |
Table 5.
Parameter values for the linear relationship between the peak energy and the channel.
| Measurement | k | F | ||
|---|---|---|---|---|
| (2BCE3-0006) LS1_1 | ||||
| (2BCE3-0006) LS1_2 | ||||
| (2BCE3-0007) calibration target | ||||
| (2BCE3-0008) LS2 |
Table 7.
Definitions of geometrical parameters of APXS.
| Parameter | Definition |
|---|---|
| a source area whence the X-ray radiation | |
| an effective detection area on lunar soil | |
| an active area of SDD | |
| a unit area of for each equally sized grid cell (1 < m < M) | |
| a unit area of for each equally sized grid cell (1 < k < K) | |
| a unit area of for each equally sized grid cell (1 < n < N) | |
| the distance between the center of two grid cells for k and n | |
| the distance between the center of two grid cells for k and m |
Table 8.
Summary of the definitions of parameters in the function of detection efficiency.
| Parameter | Definition | Value |
|---|---|---|
| R | Synthetic responsivity of the detector | 0.946 |
| Equivalent to the X-ray emission angle that incident to the detector | / | |
| Mass attenuation coefficient of Be window of the detector at energy | cf. Table 6 | |
| Mass attenuation coefficient of silicon oxide () layer of the detector at energy | cf. Table 6 | |
| Mass attenuation coefficient of active volume of the detector at energy | cf. Table 6 | |
| Density of Be window of the detector | 1.85 g/cm | |
| Density of silicon oxide () layer of the detector crystal | 2.648 g/cm | |
| Density of p-type dead layer and active volume of the detector crystal | 2.33 g/cm | |
| Thickness of Be window of the detector | 8 | |
| Thickness of silicon oxide () layer of the detector crystal | 0.06 | |
| Thickness of p-type dead layer of the detector crystal with nonmetallic contact electrode | 0.10 | |
| Thickness of active volume of the detector crystal | 450 |
Table 9.
Chemical compositions with their 1 statistical errors in wt.%, normalized to 99% on account of missing elements, such as Mn, Ni, Cr, P, and Na. Data of orbital chemical compositional measurements are from the gamma-ray spectrometer (GRS) onboard Lunar Prospector (LP) in the region (43.0–45.0N, 17.5–20.0W) around CE-3 landing site [10,12].
| Components | LS1_1 (%) | ± | LS1_2 (%) | ± | LS1 (%) | ± | LS2 (%) | ± | LP GRS (%) | ± |
|---|---|---|---|---|---|---|---|---|---|---|
| MgO | 9.6 | 1.3 | 11.9 | 1.4 | 10.7 | 1.4 | 10.2 | 1.7 | 8.4 | 4.2 |
| AlO | 11.0 | 1.0 | 11.2 | 1.0 | 11.1 | 1.0 | 10.3 | 1.0 | 8.4 | 6.6 |
| SiO | 41.2 | 0.5 | 40.5 | 0.4 | 40.9 | 0.5 | 41.3 | 0.9 | 40.4 | 5.6 |
| KO | 0.13 | 0.01 | 0.12 | 0.01 | 0.13 | 0.01 | 0.14 | 0.01 | 0.19 | 0.03 |
| CaO | 9.9 | 0.4 | 9.6 | 0.4 | 9.8 | 0.4 | 10.3 | 0.4 | 14.3 | 3.8 |
| TiO | 3.87 | 0.02 | 3.71 | 0.02 | 3.79 | 0.02 | 4.07 | 0.02 | 5.0 | 1.2 |
| FeO | 23.3 | 0.9 | 21.9 | 0.8 | 22.6 | 0.9 | 22.6 | 1.0 | 20.4 | 1.9 |
Disclaimer/Publisher’s Note: The statements, opinions and data contained in all publications are solely those of the individual author(s) and contributor(s) and not of MDPI and/or the editor(s). MDPI and/or the editor(s) disclaim responsibility for any injury to people or property resulting from any ideas, methods, instructions or products referred to in the content. |
© 2023 by the authors. Licensee MDPI, Basel, Switzerland. This article is an open access article distributed under the terms and conditions of the Creative Commons Attribution (CC BY) license (https://creativecommons.org/licenses/by/4.0/).
Share and Cite
MDPI and ACS Style
Ng, M.-H.; Zhang, X.; Xu, Y.; Li, L. Major Elements Concentrations in Chang’E-3 Landing Site from Active Particle-Induced X-ray Spectrometer. Remote Sens. 2023, 15, 1643. https://doi.org/10.3390/rs15061643
AMA Style
Ng M-H, Zhang X, Xu Y, Li L. Major Elements Concentrations in Chang’E-3 Landing Site from Active Particle-Induced X-ray Spectrometer. Remote Sensing. 2023; 15(6):1643. https://doi.org/10.3390/rs15061643
Chicago/Turabian StyleNg, Man-Hei, Xiaoping Zhang, Yi Xu, and Liansheng Li. 2023. "Major Elements Concentrations in Chang’E-3 Landing Site from Active Particle-Induced X-ray Spectrometer" Remote Sensing 15, no. 6: 1643. https://doi.org/10.3390/rs15061643
Note that from the first issue of 2016, this journal uses article numbers instead of page numbers. See further details here.